![[MISSING IMAGE: lg_summithotel-4c.jpg]](https://capedge.com/proxy/DEF 14A/0001104659-22-040182/lg_summithotel-4c.jpg)

April 3, 2024
Dear Fellow Stockholder:
You are cordially invited to attend the 20222024 annual meeting of stockholders of Summit Hotel Properties, Inc., to be held on Thursday,Wednesday, May 12, 2022,22, 2024, at 8:00 a.m. Central Time, at the Hampton Inn & Suites located at 200 San Jacinto Boulevard, Austin, Texas 78701.
The attached proxy statement, accompanied by the notice of annual meeting, describes the matters expected to be acted upon at the meeting. We urge you to review these materials carefully and to use this opportunity to take part in the affairs of Summit Hotel Properties, Inc. by voting on the matters described in this proxy statement. We hope that you will be able to attend the meeting.
Your vote is important. Whether or not you plan to attend the meeting, please complete the enclosed proxy card and return it as promptly as possible or authorize a proxy to vote your shares by calling the toll-free telephone number, or via the internet. The enclosed proxy card contains instructions regarding all three methods of voting. If you attend the meeting, you may continue to have your shares voted as you have previously instructed, or you may withdraw your proxy at the meeting and vote your shares in person. We look forward to seeing you at the meeting.
Sincerely,

Jonathan P. Stanner
Director, President & Chief Executive Officer
SUMMIT HOTEL PROPERTIES, INC.
13215 BEE CAVE PARKWAY, SUITE B-300
AUSTIN, TEXAS 78738
NOTICE OF ANNUAL MEETING OF STOCKHOLDERS
TO BE HELD ON MAY 12, 202222, 2024
The 20222024 annual meeting of stockholders of Summit Hotel Properties, Inc., will be held on Thursday,Wednesday, May 12, 2022,22, 2024, at 8:00 a.m., Central Time, at the Hampton Inn & Suites located at 200 San Jacinto Boulevard, Austin, Texas 78701 for the following purposes:
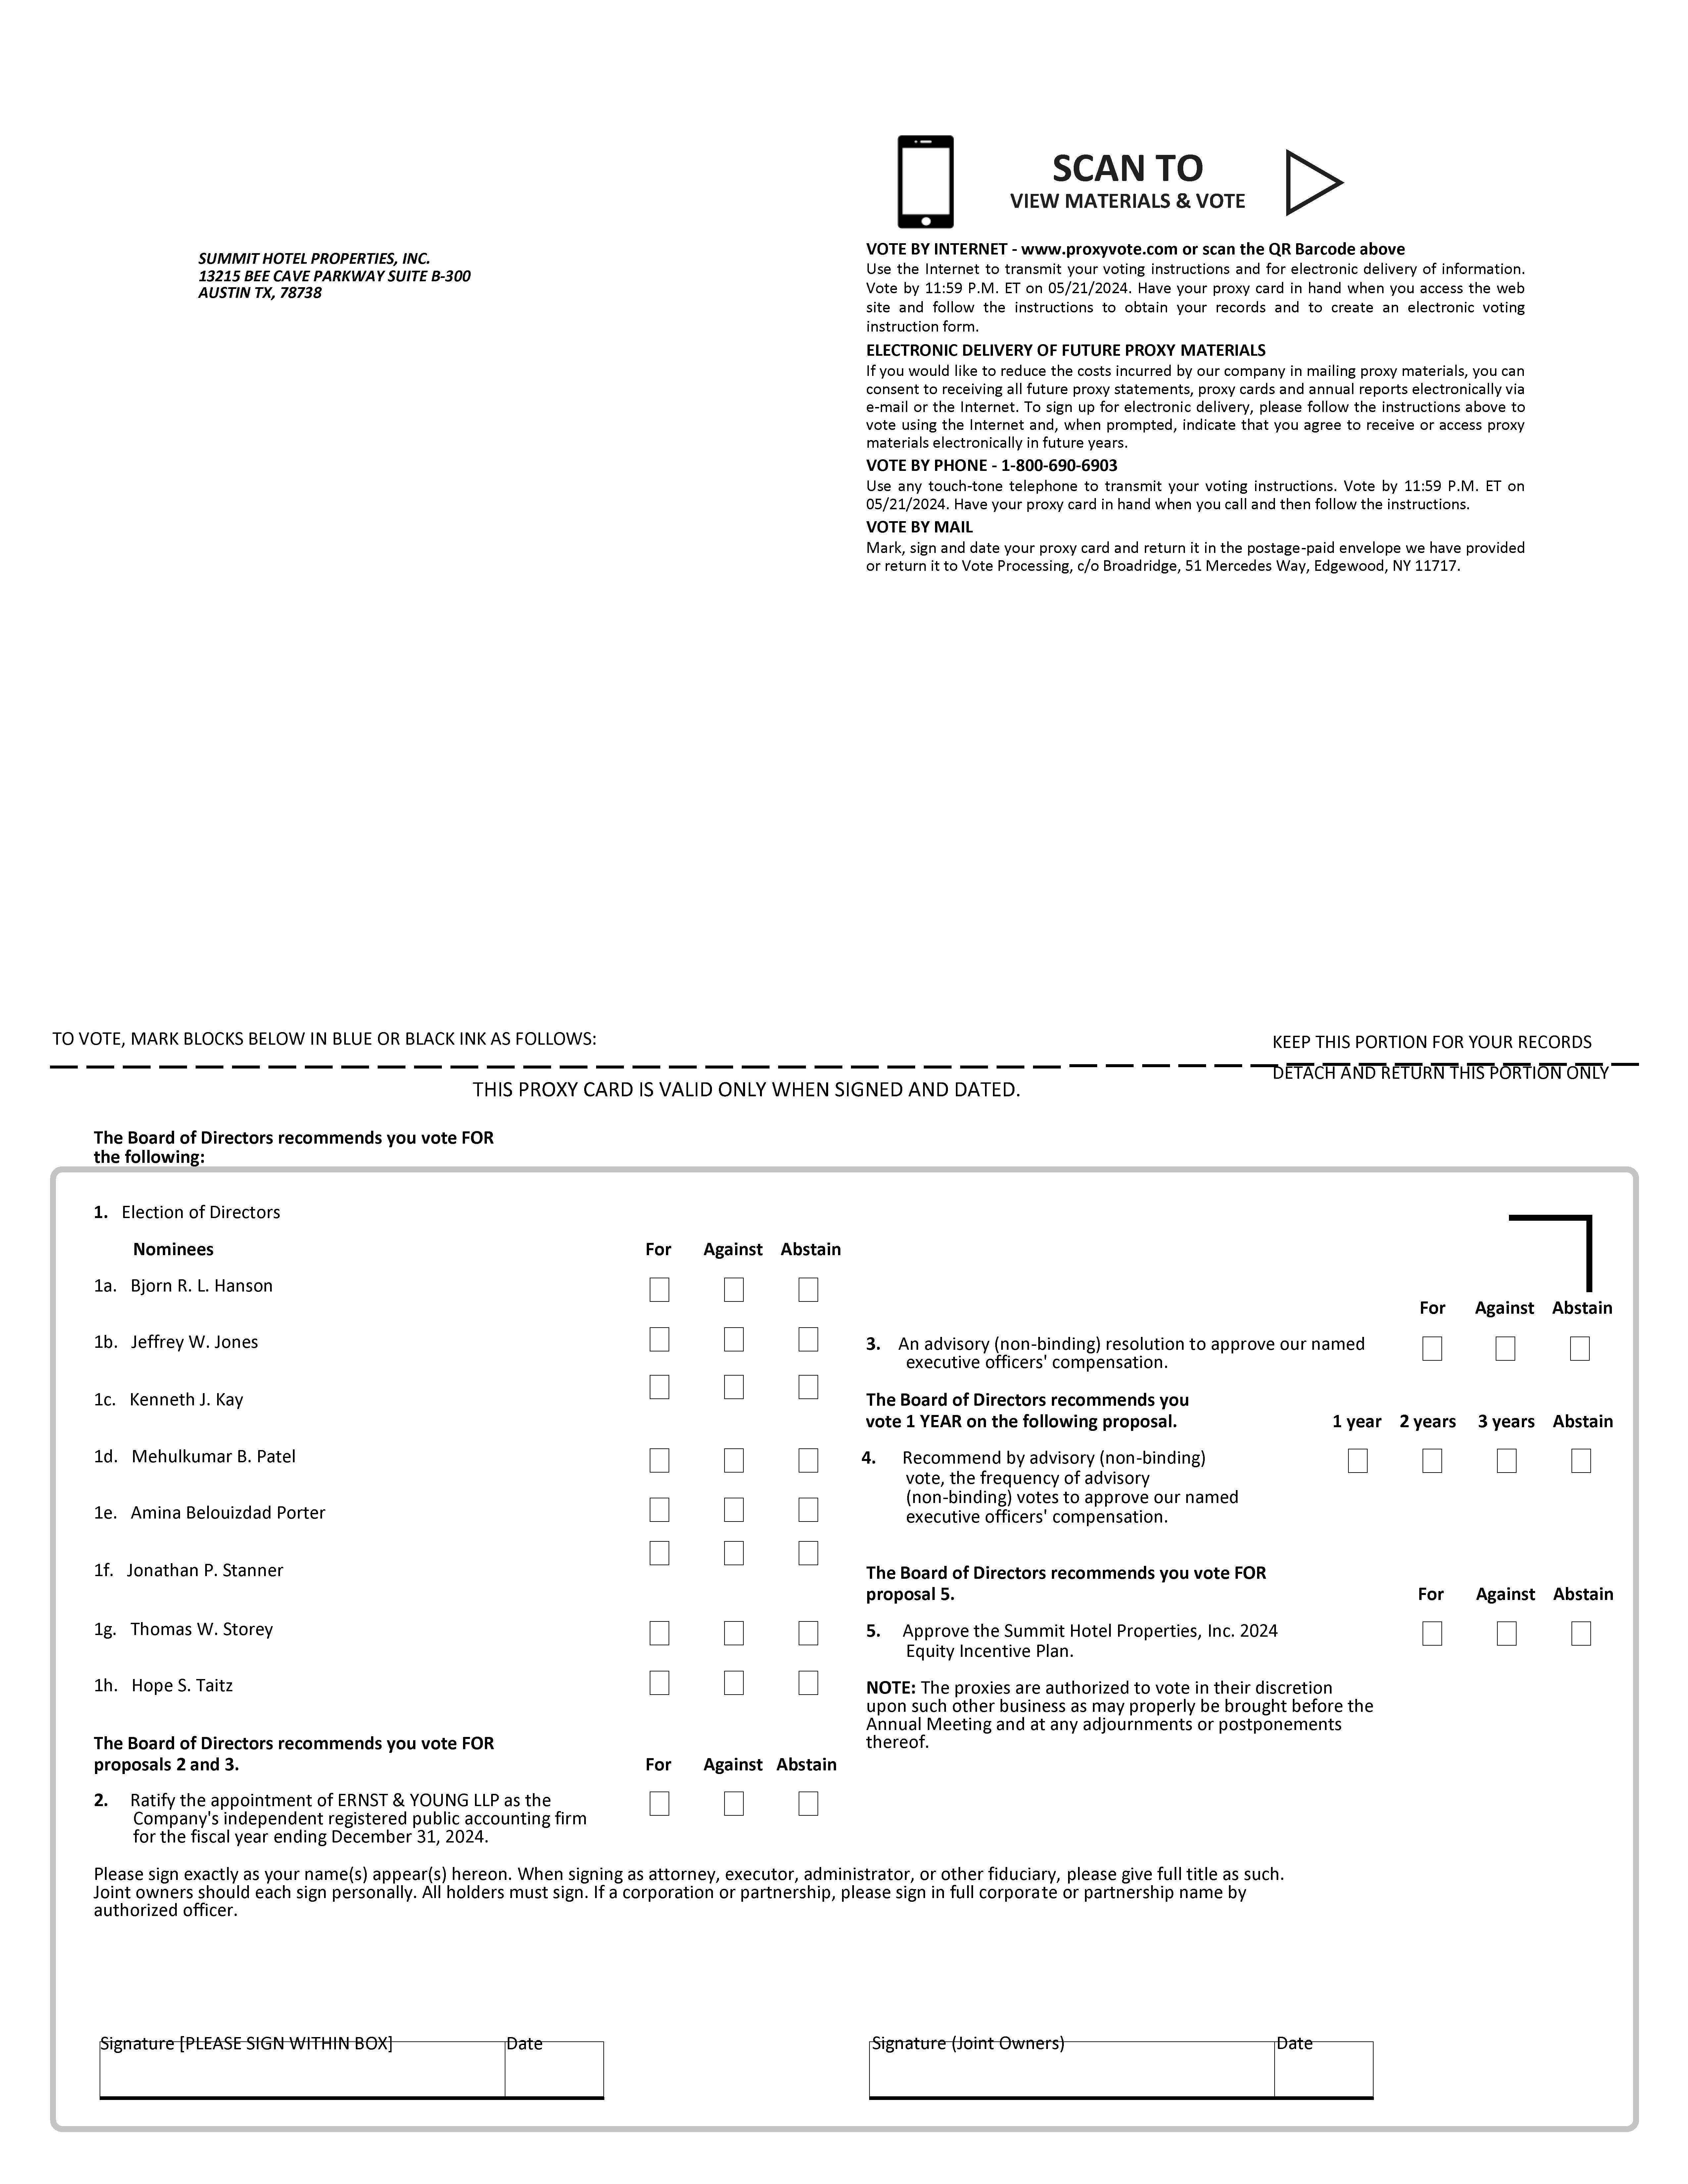
1. To elect eight directors nominated by our Board of Directors, each to serve until the next annual meeting of our stockholders and until their successors are duly elected and qualify;qualified;
2.
To consider and vote upon the ratification of the appointment of Ernst & Young, LLP as the Company’s independent registered public accounting firm for 2022;2024;
3.
To consider and vote upon an advisory (non-binding) resolution onto approve our named executive officers' compensation;
4. To recommend by advisory (non-binding) vote, whether an advisory (non-binding) stockholder vote to approve our named executive officers' compensation should occur every 1, 2 or 3 years;
5. To consider and vote upon a proposal to approve the Summit Hotel Properties, Inc. 2024 Equity Incentive Plan; and
6. To transact such other business as may be properly brought before the annual meeting and at any adjournments or
postponements thereof.
You may vote if you were a holder of record of our common stock at the close of business on March 11, 2022, the record date.6, 2024 (the "Record Date").
Whether or not you plan to attend the annual meeting your vote is very important, and the Company encourages you to promptly authorize a proxy to vote your shares.
BY ORDER OF THE BOARD OF DIRECTORS | |||||
![[MISSING IMAGE: sg_christopher-eng.jpg]](https://capedge.com/proxy/DEF 14A/0001104659-22-040182/sg_christopher-eng.jpg)  | |||||
Christopher Eng Executive Vice President, General Counsel, Chief Risk Officer and Secretary | |||||
Austin, Texas
April 3, 2024
Contents
Company's 2023 Highlights | ||||||||||||
Company’s Workforce Highlights as of March 31, 2024 | ||||||||||||
2023 Compensation Program | ||||||||||||
PROXY STATEMENT
2022
2024 ANNUAL MEETING OF STOCKHOLDERS
GENERAL INFORMATION
Proxy Solicitation
The Board of Directors (the “Board”) of Summit Hotel Properties, Inc., has made these materials available to you on the internet or, upon your request, has delivered printed versions of these materials to you by mail, in connection with its solicitation of proxies for its 20222024 annual meeting of stockholders to be held on May 12, 2022,22, 2024, at 8:00 a.m., Central Time, at the Hampton Inn & Suites located at 200 San Jacinto Boulevard, Austin, Texas 78701, and at any adjournments or postponements thereof. These materials were first made available to stockholders on March 30, 2022.April 3, 2024. Unless the context requires otherwise, references in this proxy statement to “Summit,” “we,” “our,” “us” and the “Company” refer to Summit Hotel Properties, Inc. and its consolidated subsidiaries.
Pursuant to rules adopted by the Securities and Exchange Commission (the “SEC”), we have elected to provide access to our proxy materials on the internet. Accordingly, we are sending a Notice of Internet Availability of Proxy Materials (the “Notice of Internet Availability”) to our stockholders. All stockholders will have the ability to access the proxy materials at www.proxyvote.com or request to receive a printed set of the proxy materials by mail or an electronic set of materials by email. Instructions on how to access the proxy materials on the internet or to request a printed copy may be found in the Notice of Internet Availability. Stockholders also may request to receive proxy materials in printed form by mail or electronically by email on an ongoing basis.
In addition to solicitation by mail, certain of our directors, officers and employees may solicit proxies by telephone, personal contact or other means of communication. They will not receive any additional compensation for these activities. Also, brokers, banks and other persons holding common stock on behalf of beneficial owners will be requested to solicit proxies or authorizations from beneficial owners. We will bear all costs incurred in connection with the preparation, assembly and mailing of the proxy materials and the solicitation of proxies and will reimburse brokers, banks and other nominees, fiduciaries and custodians for reasonable expenses incurred by them in forwarding proxy materials to beneficial owners of our common stock. Although no proxy solicitor has been engaged at this time, we may determine it is necessary to employ an outside firm to assist in the solicitation process. If so, we will pay the proxy solicitor reasonable and customary fees.
No person is authorized to give any information or to make any representation not contained in this proxy statement and, if given or made, you should not rely on that information or representation as having been authorized by us. The delivery of this proxy statement does not imply that the information herein has remained unchanged since the date of this proxy statement.
Summit Contact Information
The mailing address of our principal executive office is 13215 Bee Cave Parkway, Suite B-300, Austin, Texas 78738, and our main telephone number is (512) 538-2300. We maintain an internet website at www.shpreit.com.www.shpreit.com. Information at or connected to our website is not and should not be considered part of this proxy statement.
1
QUESTIONS AND ANSWERS ABOUT THE ANNUAL MEETING
On what am I voting?
You are being asked to consider and vote on the following proposals:
•Election of the eight director nominees named in this proxy statement (Proposal 1);
•
Ratification of Ernst & Young, LLP (“EY”) as our independent registered public accounting firm for 20222024 (Proposal 2); and
•
An advisory (non-binding) resolution to approve our named executive officers' compensation (Proposal 3).;
•Approval of the Summit Hotel Properties, Inc. 2024 Equity Incentive Plan (the "2024 Plan") (Proposal 5).
Who can vote?
Holders of our common stock as of the close of business on the record date,Record Date, March 11, 2022,6, 2024, are entitled to vote, either in person or by proxy, at the annual meeting. Each share of our common stock is entitled to one vote. Cumulative voting is not permitted in the election of directors.
How do I vote or authorize a proxy to vote my shares?
By Proxy. Before the annual meeting, you may authorize a proxy to vote your shares in one of the following ways:
•By telephone;
•
By internet; or
•
By completing and signing your proxy card and mailing it in time to be received prior to the annual meeting.
The telephone and internet voting procedures are designed to confirm your identity, to allow you to give your voting instructions and to verify that your instructions have been properly recorded. If you wish to vote by telephone or internet, please follow the instructions that are included in the Notice of Internet Availability and the proxy card. If you mail us your properly completed and signed proxy card, or vote by telephone or internet, your shares will be voted according to the choices that you specify.
If you sign and mail your proxy card without marking any choices, your proxy will be voted:
FORthe election of all director nominees named in this proxy statement (Proposal 1);
FOR the ratification of EY as our independent registered public accounting firm for 20222024 (Proposal 2); and
FOR the approval of an advisory (non-binding) resolution onto approve our named executive officers' compensation
(Proposal 3);
FOR 1 YEAR as the frequency for future advisory (non-binding) votes to approve our named executive officers’ compensation (Proposal 3)4); and
FOR the approval of the 2024 Plan (Proposal 5).
We do not expect that any other matters will be brought before the annual meeting. If an issue should arise for vote at the annual meeting that is not included in the proxy material, the proxy holders will vote your shares in accordance with their discretion.
2
In Person. If your shares are registered directly in your name with our transfer agent, you are considered the stockholder of record with respect to those shares and you may attend the annual meeting and vote in person. If your shares are held in the name of your broker, bank or other nominee and you wish to attend the annual meeting, you must bring an account statement or letter from the nominee indicating that you were the owner of the shares on March 11, 2022.6, 2024. If your shares are held in the name of your broker, bank or other nominee and you wish to vote at the annual meeting, you must obtain a legal proxy from your broker, bank or other nominee that holds your shares giving you the right to those shares.
May I change or revoke my vote?
Yes. You may change your vote or revoke your proxy at any time prior to the annual meeting by:
•Notifying our Secretary in writing that you are revoking your proxy;
•
Providing another signed proxy that is dated after the proxy you wish to revoke;
•
Using the telephone or internet voting procedures; or
•
Attending the annual meeting and voting in person. Attendance at the annual meeting will not, by itself, revoke a duly executed proxy.
Will my shares be voted if I do not provide my proxy?
It depends on whether you hold your shares in your own name or in the name of a bank or brokerage firm. If you hold your shares directly in your own name, they will not be voted unless you provide a proxy or vote in person at the annual meeting.
Brokerage firms generally have the authority to vote customers’ un-voted shares on certain “routine” matters. If your shares are held in the name of a brokerage firm, the brokerage firm can vote your shares for the ratification of EY as our independent registered public accounting firm for 20222024 (Proposal 2) if you do not provide your voting instructions timely, because this matter is considered “routine” under the applicable rules. The other items (Proposals Nos. 1, 3, 4 and 3)5) are not considered “routine” and therefore may not be voted by your broker without instruction.
What constitutes a quorum?
As of the record date,Record Date, a total of 106,337,785107,593,373 shares of our common stock were issued and outstanding and entitled to vote at the annual meeting. To conduct the annual meeting, a majority of the shares entitled to vote must be present in person or by proxy. This is referred to as a “quorum.” If you submit a properly executed proxy card or authorize a proxy to vote by telephone or on the internet, your shares will be counted for purposes of determining the presence of a quorum. Abstentions and broker “non-votes” will be counted as present and entitled to vote for purposes of determining a quorum. A broker “non-vote” occurs when a bank, broker or other nominee who holds shares for another person has not received voting instructions from the owner of the shares and, under the applicable rules, does not have discretionary authority to vote on a matter.
What vote is needed to approve the matters submitted?
Election of Directors (Proposal 1). The affirmative vote of a majority of all the votes cast at a meeting at which a quorum is present is necessary for the election of a director in an uncontested election. For purposes of this vote, abstentions and broker non-votes will not be counted as votes cast and will have no effect on the result of the vote for this proposal. The Board has adopted a policy on voting regarding directors. Under the policy, at any meeting of stockholders at which members of the Board are to be elected by the stockholders in an uncontested election, any nominee for director who receives a greater number of votes “against” his or her election than votes “for” his or her election will submit to the Board a written offer to resign from the Board no later than two weeks after the certification of the voting results. For additional information regarding this policy, please see “The Board of Directors and Its Committees — Policy on Voting Regarding Directors.”
Ratification of Appointment of EY (Proposal 2). The affirmative vote of a majority of the votes cast at the annual meeting is required to approve this proposal. For purposes of this vote, abstentions will not be counted as votes cast and will have no effect on the result of the vote for this proposal.
3
Approval on an Advisory (Non-Binding) Resolution onto Approve Executive Compensation (Proposal 3). The affirmative vote of a majority of the votes cast at the annual meeting is required to approve this proposal. For purposes of this advisory vote, abstentions and broker non-votes will not be counted as votes cast and will have no effect on the result of the vote for this proposal.
Approval on an Advisory (Non-Binding) Basis, of the Frequency of Future Advisory Votes to Approve Our Named Executive Officers’ Compensation (Proposal 4). We will consider the frequency (either 1 YEAR, 2 YEARS or 3 YEARS) that receives a majority of the votes cast at the annual meeting as the frequency for future advisory votes on our named executive officers’ compensation that has been recommended by our stockholders. For purposes of this advisory vote, abstentions and broker non-votes will not be counted as votes cast and will have no effect on the result of the vote. In the event that no option receives a majority of the votes cast, we will consider the period that receives the most votes to be the option that has been recommended by our stockholders.
Approval of the 2024 Plan (Proposal 5). The affirmative vote of a majority of the votes cast at the annual meeting is required to approve this proposal. For purposes of this vote, abstentions and broker non-votes will not be counted as votes cast and will have no effect on the result of the vote for this proposal.
Householding. We are sending only a single Notice of Internet Availability to any household at which two or more stockholders reside if they share the same last name or we reasonably believe they are members of the same family unless we have received instructions to the contrary from any stockholder at that address. This practice is known as “householding” and is permitted by rules adopted by the SEC. This practice reduces the volume of duplicate information received at your household and helps us to reduce
costs. We will deliver promptly, upon written request or oral request, a separate copy of the Notice of Internet Availability to a stockholder at a shared address to which a single copy of the document was previously delivered. If you received a single copy of this document for your household for this year, but you would prefer to receive your own copy, you may direct requests for separate copies in the future to the following address: Summit Hotel Properties, Inc., Attention: Secretary, 13215 Bee Cave Parkway, Suite B-300, Austin, Texas 78738. If you are a stockholder who receives multiple copies of our proxy materials, you may request householding by contacting us in the same manner and requesting a householding consent form.
4
PROPOSAL 1:
ELECTION OF DIRECTORS
Introduction
As of March 30, 2022,April 3, 2024, the Board has nineeight members. As previously reported on Form 8-K filed by the Company on December 7, 2021, Mr. Daniel P. Hansen’s tenure as a director will end as of the date of our 2022 annual meeting. In connection with Mr. Hansen’s departure, the Board will be decreased from nine to eight directors. The eight people named below, each of whom currently serves on the Board, have been recommended by the Nominating and Corporate Governance Committee and nominated by our Board to serve on the Board until our 20232025 annual meeting of stockholders and until their respective successors are duly elected and qualify.qualified. The Board has no reason to believe that any of the nominees will be unable, or will decline, to serve if elected. The Board has determined that each director nominee named below except Mr. Stanner is independent under applicable SEC and New York Stock Exchange (the “NYSE”) rules.
Recommendation:
OUR BOARD OF DIRECTORS UNANIMOUSLY RECOMMENDS A VOTE FOR EACH OF THE NOMINEES.
The following table sets forth the name, position with the Company and age (as of the annual meeting) of each nominee for election to the Board at the annual meeting:
Board of Directors Nominees
| Name, Age | Director Since | Position | Service on Other U.S. Public Company Boards | ||||||||||||||||||||||||||||
| Bjorn R. L. Hanson, | 2011 | Independent Director | N/A | ||||||||||||||||||||||||||||
| Jeffrey W. Jones, | 2014 | Chairman of the Board and Chair of Audit Committee | Noodles & Company (NASDAQ: NDLS) | ||||||||||||||||||||||||||||
| Kenneth J. Kay, | 2014 | Independent Director and Chair of Compensation Committee | (NYSE: GENI) | ||||||||||||||||||||||||||||
| 2022 | Independent Director | N/A | |||||||||||||||||||||||||||||
| 2021 | Independent Director | N/A | |||||||||||||||||||||||||||||
| Jonathan P. Stanner, | 2021 | Director, President and Chief Executive Officer | N/A | ||||||||||||||||||||||||||||
| Thomas W. Storey, | 2011 | Independent Director | N/A | ||||||||||||||||||||||||||||
| Hope S. Taitz, | 2017 | Independent Director and Chair of Nominating and Corporate Governance Committee | |||||||||||||||||||||||||||||
We believe that all of the nominees are intelligent, experienced, collegial, insightful and proactive with respect to management and risk oversight and that they exercise good judgment. The biographical descriptions below set forth certain information with respect to each nominee, including the experience, qualifications, diversity, attributes or skills of each nominee that led us to conclude that he or she should serve as a director, if elected.
Bjorn R. L. Hanson. Dr. Hanson has been a member of the Board since February 2011.2011 and currently serves as a member of the Audit Committee and Nominating and Corporate Governance Committee. Dr. Hanson served as our Lead Independent Director from June 2015 to January 2017, chaired the Audit Committee from December 2013 to June 2015 and chaired the Nominating and Corporate Governance Committee from May 2016 to May 2020. Dr. Hanson’s career has been in the hospitality industry. He founded the hospitality, sports, convention and leisure practices and held various positions at PricewaterhouseCoopers and Coopers & Lybrand, including National Industry Chairman for the Hospitality Industries, National Service Line Director for Hospitality Consulting, National Industry Chairman for Real Estate, Real Estate Service Line Director and National Director of Appraisal Services. Additionally, he served on PricewaterhouseCooper’s U.S. leadership committee and global financial advisory services management committee. Dr. Hanson was also managing director with two Wall Street firms, Kidder, Peabody & Co. and PaineWebber Inc., for which he led banking and research departments for lodging and gaming. He joined the New York University in 2008 as a clinical professor teaching in the Tisch Center for graduate
5
and undergraduate hospitality and tourism programs. In 2010, he was appointed as the NYU divisional dean of that program and in 2012 was appointed co-interim dean of one of NYU’s 18 schools and colleges. He is now Adjunct Clinical Professor. Dr. Hanson is an active lodging consultant, including as an expert witness and researcher, and is the Executive Vice President of 795 Fifth Avenue Corporation, the entity that owns The Pierre, A Taj Hotel, New York. Dr. Hanson received a B.S. from Cornell University School of Hotel Administration, an M.B.A. from Fordham University and a Ph.D. from New York University.
The Board, upon the recommendation of the Nominating and Corporate Governance Committee, has determined that Dr. Hanson should serve as a director, if elected, because he brings a wide range of experience in consulting and investment banking in the hospitality industry to the Board. He also brings research and quantitative analysis perspectives on the hospitality and tourism industries, which enhances the ability of the Board to analyze macroeconomic issues and trends relevant to our business. Finally, Dr. Hanson’s leadership roles in market trend analysis, economic analysis and financial analysis specific to our industry provide the Board with additional depth in analyzing financial reporting issues faced by companies similar to ours.
Jeffrey W. Jones. Mr. Jones has been a member of the Board since July 2014 and currently serves as Chairman of the Board and chair of the Audit Committee and is a member of the Compensation Committee. Prior to being appointed Chairman of the Board on January 1, 2022, Mr. Jones served as the Company’s Lead Independent Director. From 2003 to 2012, Mr. Jones served as the Chief Financial Officer for Vail Resorts, Inc. (NYSE: MTN), a publicly held resort management company, and also served as a member of the Board of Directors of Vail Resorts, Inc. from 2008 through 2012. In addition, later in his tenure at Vail Resorts, Inc., Mr. Jones also served as President —- Lodging, Retail and Real Estate. Mr. Jones is also currently Chairman of the Board of Directors, chairs the audit committee and is a member of the compensation committee for Noodles & Company (NASDAQ: NDLS), a publicly held fast-casual restaurant chain. Mr. Jones also serves on the Board of Directors isof Invited (f/k/a ClubCorp), a privately held hospitality company. From December 2013 to January 2024, Mr. Jones served on the Board of Directors, was the Lead Independent Director, chairschaired the audit and finance committee and iswas a member of the compensation committee of Hershey Entertainment and Resorts, a privately held entertainment and hospitality company. Mr. Jones also serves on the Board of Directors of ClubCorp, a privately held hospitality company. He is also a member of the US Bank Advisory Board. Prior to joining Vail Resorts, Inc., Mr. Jones held chief financial officer positions with Clark Retail Enterprises and Lids Corporation. Mr. Jones received a B.A. in Accounting and American Studies from Mercyhurst College n/(n/k/a Mercyhurst UniversityUniversity) and is a member of the American Institute of Certified Public Accountants (AICPA).
The Board, upon the recommendation of the Nominating and Corporate Governance Committee, has determined that Mr. Jones should serve as a director, if elected, because of his significant management, financial, hospitality industry and mergers and acquisition experience and expertise, which he has acquired through his fifteen years as a chief financial officer, including ten years as chief financial officer and four years as a director, as well as president of lodging, retail and real estate, of a publicly held resort management company. In addition, Mr. Jones’s other experience in leadership roles as a corporate board director and audit committee member and chair provides the Board with perspective into corporate governance best practices.
Kenneth J. Kay. Mr. Kay has been a member of the Board since July 2014 and currently serves as chair of the Compensation Committee and is a member of the Audit Committee. Since March 2023, he also serves on the Board of Directors, is the chair of the compensation committee and is a member of both the audit committee and the nominating and corporate governance committee of Genius Sports Ltd. (NYSE: GENI), the official data, technology and broadcast partner company that powers the global ecosystem connecting sports, betting and media. From July 2015 until July 2022, Mr. Kay is currentlywas the Chief Financial Officer and a member of the Office of the CEO of MGM Holdings, Inc., a leading entertainment studio focused on the production and global distribution of film and television content, and a wholly owned subsidiary ofthat was acquired by Amazon.com, Inc. Mr. Kay is also a Managing Director of Raven LLC, an investment and advisory services firm located in Las Vegas, Nevada, a position he has held since co-founding the firm in 2012. Raven LLC provides debt and equity capital and management consulting and advisory services to small and medium sized businesses.March 2022. Previously, Mr. Kay held the position of Chief Financial Officer of Las Vegas Sands Corp. (“Las Vegas Sands”) (NYSE: LVS) from December 2008 to July 2013, where he was responsible for all worldwide financial, planning, procurement, technologya leading global hospitality and risk aspects of thegaming company. Prior to working for Las Vegas Sands, Mr. Kay was Senior Executive Vice President and Chief Financial Officer of CB Richard Ellis Group, Inc. (“CBRE”) (NYSE: CBG), a global commercial real estate services firm, from June 2002 to December 2008. Mr. Kay began his career with PricewaterhouseCoopers, primarily focusing his efforts on large, publicly owned multinational companies. After leaving public accounting, his career included senior financial and operational roles at Ameron International, Systemed Inc., Universal Studios and, just prior to CBRE, as Chief Financial Officer of Dole Food Company, Inc. (formerly NYSE: DOLE). Mr. Kay is a member of the Board of Governors of Cedars Sinai Medical Center and The Board of AdvisorsCouncilors of the USC Leventhal School of Accounting. Mr. Kay received a B.S. degree in accounting and
6
an M.B.A. degree from the University of Southern California. Mr. Kay is a Chartered Global Management Accountant, a Certified Public Accountant and a member of the American Institute of Certified Public Accountants.
The Board, upon the recommendation of the Nominating and Corporate Governance Committee, has determined that Mr. Kay should serve as a director, if elected, because of his professional background and experience, education, Fortune 500 senior-executive level positions in real estate and hospitality and his extensive finance, accounting, operational and mergers and acquisitions experience and expertise.
Mehulkumar B. Patel. Mr. Patel joined the Board in January 2022 upon the substantial completion of the Company’s acquisition of a 27-property portfolio from NewcrestImage. He has been Chairman and CEO of privately owned NewcrestImage since the Dallas-based firm was formed in early 2013 to harness the unique skills and synergies of Newcrest Management and Image Hospitality. From 2013 to 2014, Mr. Patel served as the youngest chairman in the history of the Asian American Hotel Owners Association (AAHOA). He continues to be actively involved in hotel industry leadership roles, serving on the brand councils of, AC Hotels for Marriott International, Hyatt Place and Hyatt House for Hyatt Hotels Corporation, and Hampton Inn & Suites for Hilton Worldwide. Currently, he is an owner and serves on the Board of Directors of American Bank, a community bank located in North Dallas, and on the CEO Advisory Board of Aimbridge Hospitality, a global third-party hotel management company.Dallas. Mr. Patel has previously served on the La Quinta Brand Council and the IHG Owners Association. Born in India, he immigrated to the United States at age 14 and went on to earn a degree in computer information systems at the University of Texas at Arlington.
The Board, upon the recommendation of the Nominating and Corporate Governance Committee, has determined that Mr. Patel should serve as a director, if elected, because of his professional background and experience in the real estate and hospitality industries. His diverse background and upbringing offer unique perspective to the Board and makes Mr. Patel well suited to serve on the Board.
Amina Belouizdad Porter. Ms. Belouizdad Porter has been a member of the Board since May 2021 and currently serves as a member of the Compensation Committee and Nominating and Corporate Governance Committee. From August 2018 to December 2022, Ms. Belouizdad Porter served as the Co-CEO of PS (formerly The Private Suite), a high growth private equity backed company that operates private airport terminals for commercial flights. In January 2023, Ms. Belouizdad Porter took over the role as CEO of PS. Prior to joining PS, she was a Senior Director at Lionstone Investments, from 2013 through July 2018, where she executed on over $1 billion in transactions in multiple real estate classes across the United States. Previously, she spent six years living and working in China where she was Director at China's first boutique hotel brand, overseeing its development and growth.
Ms. Belouizdad is originally from Algeria and has lived in the UAE, Canada, China and the United States. She speaks five languages and graduated from McGill University (Montreal, QC) with a Bachelor of Commerce, Major in Finance and received her M.B.A., Major in Finance and Real Estate from The Wharton School of the University of Pennsylvania.
The Board, upon the recommendation of the Nominating and Corporate Governance Committee, has determined that Ms. Belouizdad should serve as a director, if elected, because of her professional and educational experiences and her diverse background. Her background and experiences offer unique perspective to the Board and makes Ms. Belouizdad well suited to serve on the Board.
Jonathan P. Stanner. Mr. Stanner serves as our President and Chief Executive Officer. He was appointed President, Chief Executive Officer and to the Board effective January 15, 2021. Mr. Stanner’sStanner's service as President and Chief Executive Officer provides a critical link between management and the Board, enabling the Board to perform its oversight function with the benefits of management’smanagement's perspectives on the business. Mr. Stanner served as our Executive Vice President, Chief Financial Officer and Treasurer from
March 2018 to January 2021. Mr. Stanner served as Executive Vice President and Chief Investment Officer from April 2017 to March 2018. He serves on the Board of the American Hotel & Lodging Association, the AHLA Foundation Board of Trustees, the brand council of AC Hotels for Marriott International, Inc. and on the Hyatt Owners’ Advisory Council. Prior to joining the Company, Mr. Stanner served as Chief Executive Officer of Strategic Hotels & Resorts, Inc. (“("Strategic Hotels”Hotels"), which was publicly traded until being sold to an affiliate of The Blackstone Group L.P. in December 2015. Mr. Stanner held increasingly senior positions with Strategic Hotels during his tenure, including Director of Corporate Finance, Senior Vice President —- Capital Markets, Acquisitions, Treasurer and Chief Financial Officer.
7
Prior to joining Strategic Hotels, Mr. Stanner worked in investment banking with Bank of America. Mr. Stanner earned a Bachelor of Science in Management and a Master of Business Administration, both from the Krannert School of Management at Purdue University.
The Board, upon the recommendation of the Nominating and Corporate Governance Committee, has determined that Mr. Stanner should serve as a director, if elected, because he currently serves as our President and Chief Executive Officer and provides a critical link between the executive management team, which is responsible for the day-to-day management of the Company and the Board. We believe his service as a director enables the Board to perform its oversight function with the benefits of management’smanagement's perspectives on our business.
Thomas W. Storey. Mr. Storey has been a member of the Board since February 2011.2011 and currently serves as a member of the Compensation Committee and Nominating and Corporate Governance Committee. Mr. Storey served as our Chairman of the Board from July 2015 until January 2017 and chaired the Nominating and Corporate Governance Committee from December 2013 to May 2016. Mr. Storey has worked in the hospitality industry for more than 30 years. From 1999 to 2013 he was employed by Fairmont Raffles Hotels International (“FRHI”), a leading global hotel company with over 125 hotels worldwide under the Fairmont, Raffles and Swissôtel brands, in various roles including; President Fairmont Hotels and Resorts, Executive Vice President, Business Strategy and Executive Vice President, Global Development. From 1984 to 1999, Mr. Storey worked for multiple hospitality companies in an executive capacity including Marriott Hotels and Resorts, Doubletree Hotels, Promus Hotels and Radisson Hotels, International. Mr. Storey has been a member of various hospitality industry organizations, including the American Hotel & Lodging Association, the Travel Industry Association of America, and Professional Conference and Meeting Planners. He previously served on multiple public and private boards including Candlewood Hotels, Legacy Hotels Real Estate Investment Trust, Travelclick, LLC and the Wall Street Institute. Mr. Storey received a B.A. in economics from Bates College and an M.B.A. from the Johnson School at Cornell University.
The Board, upon the recommendation of the Nominating and Corporate Governance Committee, has determined that Mr. Storey should serve as a director, if elected, because he provides the Board with strategic vision specific to the hospitality industry. In addition, Mr. Storey has substantial leadership experience in the hospitality industry, including as Executive Vice President, Business Strategy of FRHI, where Mr. Storey was instrumental in helping lead that company through various lodging cycles. The Board expects Mr. Storey’s experience in analyzing and reacting to changing conditions in the hospitality industry will serve the Board. The Board also expects Mr. Storey’s operations experience with FRHI will help him provide valuable insights to the Board. Mr. Storey also possesses particular expertise in business travel, an important aspect of our business.
Hope S. Taitz. Ms. Taitz has been a member of the Board since July 2017 and currently serves as chair of the Nominating and Corporate Governance Committee and is a member of the Audit Committee. Ms. Taitz is currently the CEO of ELY Capital (“ELY”) and CEO of Aequi Acquisition Corp (NASDAQ: ARBG) and invests in and advises innovative companies in media, technology and the consumer industries. Prior to ELY, Ms. Taitz was the founder of Catalyst Partners, an investment management firm. After graduating with honors from the University of Pennsylvania majoring in economics and concentrating in marketing, Ms. Taitz began her investment banking career as a mergers and acquisitions analyst at Drexel Burnham Lambert, first as an analyst and then as an associate. Ms. Taitz continued as a Vice President at The Argosy Group (now part of CIBC) and a Managing Director at Crystal Asset Management. Ms. Taitz is the Chair of Aequi Acquisition Corp and sits on the Boards of Athene Holding Ltd. and MidCap Finco Holdings Limited, which are private companies. She previously served on the Boards of Apollo Residential Mortgage, Inc. (“AMTG”), Diamond Resorts, International Inc. (“DRII”), Greenlight Capital RE, Ltd. (“GLRE”("GLRE") as well as Lumenis Ltd. (“LMNS”). On the not-for-profit side, Ms. Taitz focuses on education and is an advocate for STEM.
The Board, upon the recommendation of the Nominating and Corporate Governance Committee, has determined that Ms. Taitz should serve as a director, if elected, because of her professional background, experience, education and insight into public markets. Her breadth of experience in the investment banking marketplace and board service at both the public and private levels bring unique perspective to the Board and makes Ms. Taitz well suited to serve on the Board.
PROPOSAL 2:
RATIFICATION OF APPOINTMENT OF ERNST & YOUNG, LLP
(“EY”)
(“EY”)
AS INDEPENDENT REGISTERED PUBLIC ACCOUNTING FIRM OF
THE COMPANY FOR 20222024
Our Audit Committee selected the accounting firm of EY to serve as the Company’s independent registered public accounting firm for 2022.2024. Although current laws, rules and regulations, as well as the Audit Committee charter, require the Company’s independent registered public accounting firm to be engaged, retained and supervised by the Audit Committee, the Board considers the appointment of the independent registered public accounting firm to be an important matter of stockholder concern and is submitting the appointment of EY for ratification by stockholders as a matter of good corporate practice. Even if the selection is ratified, the Audit Committee in its discretion may select a different independent registered public accounting firm at any time if it determines that such a change would be in the best interests of the Company. If our stockholders do not ratify the Audit Committee’s selection, the Audit Committee will take that fact into consideration, together with such other factors it deems relevant, in determining its next selection of our independent registered public accounting firm. EY has served as the Company’s independent registered public accounting firm since March 2013. An EY representative will be present at the annual meeting and will be given the opportunity to make a statement if he or she so desires and will be available to respond to appropriate questions.
Recommendation:
OUR BOARD OF DIRECTORS UNANIMOUSLY RECOMMENDS A VOTE FOR RATIFICATION OF THE APPOINTMENT OF EY AS INDEPENDENT REGISTERED PUBLIC ACCOUNTING FIRM OF THE COMPANY FOR 2022.2024.
9
PROPOSAL 3:
ADVISORY (NON-BINDING) VOTE ONTO APPROVE EXECUTIVE COMPENSATION
In accordance with the requirements of Section 14A of the Securities Exchange Act of 1934, as amended (the “Exchange Act”), we are providing stockholders with the opportunity to vote on an advisory (non-binding) resolution to approve the compensation of our named executive officers as disclosed in this proxy statement in accordance with the SEC’s rules. This is commonly known as, and is referred to in this proxy statement as, a “say-on-pay” proposal or resolution. TheAs discussed in Proposal 4 below, the Board intends to hold anis recommending that stockholders vote for "1 YEAR" as the frequency of our future say-on-pay votes. Unless the Board modifies its determination on the frequency of future say-on-pay advisory votes, the next advisory (non-binding) vote on the compensation of our named executive officers each year.will be held at the 2025 annual meeting.
This say-on-pay proposal gives our stockholders the opportunity to express their views on our named executive officers’ compensation. We are asking our stockholders to indicate their support for our named executive officers’ compensation as described in this proxy statement. This vote is not limited to any specific item of compensation, but rather addresses the overall compensation of our named executive officers and our philosophy, policies and practices relating to their compensation as described in this proxy statement in accordance with SEC rules.
As described in detail under the heading “Compensation Discussion and Analysis” our executive compensation programs are designed to attract, retain and motivate our named executive officers, who are critical to our success. Our compensation program is designed to create incentives for our named executive officers to maximize long-term stockholder value. Under these programs, our named executive officers are rewarded for the achievement of our annual objectives, long-term and strategic objectives and the realization of increased stockholder value. Please refer to the “Compensation Discussion and Analysis” in this proxy statement for additional details about our executive compensation programs.
Accordingly, we are asking our stockholders to approve, in an advisory (non-binding) vote, the following resolution in respect of this Proposal 3:
“RESOLVED, that the stockholders of the Company approve, on an advisory (non-binding) basis, the compensation of the Company’s named executive officers as disclosed in this proxy statement pursuant to Item 402 of Regulation S-K, including the Compensation Discussion and Analysis, compensation tables and narrative disclosure.”
Recommendation:
OUR BOARD OF DIRECTORS UNANIMOUSLY RECOMMENDS A VOTE FOR ADOPTION OF THIS RESOLUTION ON THE ADVISORY (NON-BINDING) VOTE ONTO APPROVE EXECUTIVE COMPENSATION.
10
PROPOSAL 4:
ADVISORY (NON-BINDING) VOTE ON FREQUENCY OF ADVISORY (NON-BINDING)
VOTES TO APPROVE EXECUTIVE COMPENSATION
In accordance with the requirements of Section 14A of the Exchange Act (which was added by the Dodd-Frank Wall Street Reform and Consumer Protection Act and the related rules of the SEC), we are including in this proxy statement a separate resolution to request that our stockholders recommend, on an advisory (non-binding) basis, whether a non-binding stockholder vote to approve the compensation of our named executive officers (that is, a vote similar to the advisory (non-binding) vote in Proposal 3 of this proxy statement) should occur every 1, 2 or 3 years.
Accordingly, you may cast your advisory (non-binding) vote on your preferred voting frequency by choosing the option of 1 YEAR, 2 YEARS, 3 YEARS or abstain from voting when you vote in response to the following resolution:
"RESOLVED, that the voting choice of once every year, once every two years, or once every three years that receives the highest number of votes cast in connection with this resolution will be considered to be the frequency preferred by stockholders on an advisory (non-binding) basis for the Company to hold a non-binding vote to approve the compensation of the named executive officers."
The option of 1 YEAR, 2 YEARS or 3 YEARS that receives the highest number of votes of all the votes cast will be the frequency for the advisory (non-binding) vote regarding executive compensation that has been selected by stockholders. However, because this vote is advisory (non-binding), the Board may decide that it is in the best interests of the Company to hold an advisory (non-binding) vote regarding executive compensation more or less frequently than the frequency selected by stockholders.
We believe a 1 YEAR voting frequency is consistent with both our approach to good corporate governance and our approach to offering a compensation program that has both short- and long-term compensation components.
Recommendation:
OUR BOARD OF DIRECTORS UNANIMOUSLY RECOMMENDS THAT YOU VOTE "1 YEAR" AS THE FREQUENCY FOR FUTURE ADVISORY (NON-BINDING) VOTES TO APPROVE OUR EXECUTIVE OFFICERS’ COMPENSATION.
11
PROPOSAL 5:
APPROVE THE SUMMIT HOTEL PROPERTIES, INC. 2024 EQUITY INCENTIVE PLAN
Background to the Proposal
On March 29, 2024, the Board adopted, subject to stockholder approval, the Summit Hotel Properties, Inc. 2024 Equity Incentive Plan (the "2024 Plan"). The 2024 Plan is intended to replace our 2011 Equity Incentive Plan, as amended in 2015 and 2021 (the "2011 Plan"). Upon stockholder approval of the 2024 Plan, the 2024 Plan will become effective and will supersede and replace in its entirety the 2011 Plan, and no further awards will be granted under the 2011 Plan; however, the terms and conditions of the 2011 Plan will continue to govern any outstanding awards granted thereunder. If the 2024 Plan is not approved by our stockholders, it will not become effective, and we may continue to grant awards under the 2011 Plan until its expiration in 2031, using the shares available for issuance thereunder.
Employees and consultants of the Company and its subsidiaries, as well as members of our Board, are eligible to receive awards under the 2024 Plan. The 2024 Plan provides for the grant of stock options, stock appreciation rights ("SARs"), stock awards, performance unit awards, other equity-based awards, and incentive awards to eligible individuals.
Subject to adjustments for changes in capitalization and the 2024 Plan's share counting provisions, as of the date stockholders approve the 2024 Plan at the 2024 annual meeting of stockholders (the "Effective Date"), an aggregate of 4,406,174 shares of common stock may be issued pursuant to awards granted under the 2024 Plan, less one share for every one share granted under the 2021 Plan after March 29, 2024 and prior to the Effective Date. The 4,406,174 shares reflects 1,271,174 shares that remained available for grant under the 2011 Plan as of March 29, 2024, plus 3,135,000 newly authorized shares to be approved by the Company's stockholders on the Effective Date.
In designing the 2024 Plan, we sought to implement current compensation and governance best practices to ensure the 2024 Plan furthers our compensation plan objectives and supports long-term stockholder interests.
The material features of the 2024 Plan are summarized below. A copy of the 2024 Plan is included as Appendix A to this proxy statement. The summary below is qualified in its entirety by reference to the text of the 2024 Plan.
Key Features of the 2024 Plan
•No repricing of awards without stockholder approval. Under the 2024 Plan, awards may not be repriced without
stockholder approval if the effect would be to reduce the exercise price of the shares underlying the award.
•No evergreen feature; stockholder approval required for share reserve increases. The 2024 Plan does not provide for
an annual increase in the share reserve, and the 2024 Plan may not be amended to increase the share reserve without
stockholder approval.
•All awards are subject to clawback. All awards granted under the 2024 Plan are subject to our clawback policy.
•Aggregate non-employee director compensation limits. Under the 2024 Plan, the sum of the aggregate grant date
fair value of all stock-based and any cash fees paid to a single non-employee director, for services as a
non-employee director, in a fiscal year may not exceed $750,000.
•No discounted stock options or SARs. All options or SARs must have an exercise price that is at least 100% of the
fair market value of the shares on the date of grant.
•No liberal share recycling with respect to stock options and SARs. Shares used to pay the exercise price or
withholding taxes related to a stock option or SAR, unissued shares resulting from the net settlement of a stock
option or SAR, and shares purchased by us in the open market using the proceeds of option exercises, do not
become available for issuance as future equity awards under the 2024 Plan.
•No tax gross ups. The 2024 Plan does not provide for any tax gross-ups.
12
Key Equity Metrics
Share Usage
The following table sets forth information regarding stock-settled, time-vested equity awards granted and performance-based equity awards earned under the Company’s Equity Plan over each of the last three fiscal years.
| 2023 | 2022 | 2021 | ||||||||||||||||||||||||
| Stock Options/SARs Granted | — | — | — | |||||||||||||||||||||||
| Stock Settled, Time-Vested Restricted Stock Granted | 449,148 | 316,643 | 536,980 | |||||||||||||||||||||||
| Stock-Settled Performance Shares Earned* | 239,416 | 414,620 | 182,480 | |||||||||||||||||||||||
| Stock Granted to Independent Directors | 113,141 | 84,899 | 60,546 | |||||||||||||||||||||||
| Weighted-Average Basic Shares of Common Stock Outstanding | 105,548,911 | 105,141,743 | 104,471,038 | |||||||||||||||||||||||
| Weighted-Average Operating Partnership Units Outstanding** | 15,970,386 | 15,360,724 | 144,664 | |||||||||||||||||||||||
| Weighted Average Basic shares of Common Stock and Weighted-Average Operating Partnership Units Outstanding** | 121,519,297 | 120,502,467 | 104,615,702 | 3-Year Average Usage Rate | ||||||||||||||||||||||
| Share Usage Rate | 0.66 | % | 0.68 | % | 0.75 | % | 0.69 | % | ||||||||||||||||||
*With respect to performance units in the table above, we calculate the share usage rate based on the applicable number of shares earned each year.For reference, the performance units granted during the foregoing 3-year period at target level of performance were as follows:323,930 shares in 2021; 418,728 shares in 2022; and 425,907 shares in 2023.
**Operating Partnership Units are economically equivalent to common shares and freely exchangeable on a one-for-one basis.
Overhang as of March 29, 2024
The following table sets forth certain information as of March 29, 2024, unless otherwise noted, with respect to the Company’s 2011 Plan, the only stockholder approved equity plan pursuant to which the Company can currently grant equity awards or under which equity awards are outstanding (and no outstanding awards have been granted outside of stockholder approved plans).
| Stock Options/SARs Outstanding | — | |||||||
| Weighted-Average Exercise Price of Outstanding Stock Options/SARs | N/A | |||||||
| Weighted-Average Remaining Term of Outstanding Stock Options/SARs | N/A | |||||||
| Total Stock-Settled Full-Value Awards Outstanding* | 2,352,139 | |||||||
| Number of Shares Available for Future Grants | 1,271,174 | |||||||
| Shares of Common Stock and Operating Partnership Units Outstanding as of March 29, 2024** | 124,146,769 | |||||||
*Awards included are assumed at target level of achievement.
**Operating Partnership Units are economically equivalent to common shares and freely exchangeable on a one-for-one basis.
As of the Record Date, the closing price of a share of Company common stock was $6.40.
Dilution and Expected Duration
The Board recognizes the effect of dilution on our stockholders and has evaluated the proposed share reserve under the 2024 Plan carefully in the context of our need to attract and retain talented employees, executives and directors and to motivate and reward key personnel for achieving our business objectives and strategic priorities.The total fully diluted overhang as of March 29, 2024, would be 2.84%. If the 2024 Plan were approved, our approximate fully diluted overhang as of that date would increase to 5.16% and then would decline over time.In this context, fully diluted overhang is calculated as the sum of grants outstanding and shares available for future awards (numerator) divided by the sum of the numerator and basic shares of common stock outstanding and outstanding common operating partnership units of the Company's operating partnership.The Board believes that the proposed share reserve represents a reasonable amount of potential equity dilution to accommodate our long-term strategic priorities.
We expect that the proposed share reserve under the 2024 Plan will provide an adequate number of shares of common stock to fund our equity compensation needs for approximately five years.Expectations regarding future share usage could be affected by a number of factors such as hiring and promotion, particularly at the executive level, the rate at which shares are returned to the 2024 Plan under permitted add backs, the future performance of our stock price, and other factors.While we believe that the assumptions we used are reasonable, future share usage may differ from current expectations.If our stockholders do not approve the adoption of the 2024 Plan, our future ability to issue equity-based compensation would be materially limited, which we believe would place us at a significant competitive disadvantage.
Summary of the 2024 Plan.
Administration of the 2024 Plan
The 2024 Plan is administered by the Compensation Committee, except that the 2024 Plan will be administered by our Board with respect to awards made to directors who are not employees.
Eligibility
All of our employees and employees of our affiliates, including employees of our operating partnership, are eligible to receive grants under the 2024 Plan. In addition, directors and consultants, may receive grants under the 2024 Plan.At present, approximately 79 of our employees, which includes employees of our subsidiaries, affiliates and of our operating partnership, seven non-employee directors, and no consultants, are eligible to receive awards under the 2024 Plan.
14
Share Authorization
Subject to adjustments for changes in capitalization and the 2024 Plan's share counting provisions, as of the Effective Date, an aggregate 4,406,174 shares of common stock may be issued pursuant to awards granted under the 2024 Plan, less one share for every one share granted under the 2024 Plan after March 29, 2024 and prior to the Effective Date. The 4,406,174 shares reflects 1,271,174 shares that remained available for grant under the 2011 Plan as of March 29, 2024, plus 3,135,000 newly authorized shares approved by the Company's stockholders on the Effective Date.In connection with stock splits, dividends, re-capitalizations and certain other events, our Board shall make adjustments that it deems appropriate in the maximum number of shares and type of common stock that may be issued under the 2024 Plan and the terms of outstanding awards.
If any award, or after March 29, 2024, any award previously granted under the 2011 Plan expires, is forfeited or is terminated without having been exercised or is paid in cash without delivery of common stock, then any shares recovered by such lapsed, cancelled, expired, unexercised or cash-settled portion of such award will be re-credited (or newly credited, as applicable) to the 2024 Plan's reserve. Any shares tendered or withheld to satisfy the grant or exercise price or tax withholding obligation pursuant to any option or SAR (or, after March 29, 2024, an option or SAR previously granted under the 2011 Plan) will not be re-credited to the 2024 Plan's reserve. Any shares tendered or withheld to satisfy tax withholding obligations pursuant to any award other than an option or SAR (or, after March 29, 2024, an award other than an option or SAR previously granted under the 2011 Plan) will be re-credited (or newly credited, as applicable) to the 2024 Plan's reserve. In addition, the following shares may not again be made available for future grants or awards under the 2024 Plan: (i) shares not issued or delivered as a result of the net settlement of an outstanding SAR or option (or, after March 29, 2024, an option or SAR previously granted under the 2011 Plan) or (ii) shares repurchased on the open market with the proceeds of an option (or, after March 29, 2024, an option previously granted under the 2011 Plan) exercise price.
Non-Employee Director Limitations
The sum of any cash compensation, or other compensation, and the value (determined as of the grant date) of Awards granted to a non-employee director as compensation for services as a non-employee director during any fiscal year of the Company may not exceed $750,000 (with any compensation that is deferred counting towards this limit for the year in which the compensation is first earned, and not a later year of settlement).
Options
The 2024 Plan authorizes the grant of incentive stock options (under Section 422 of the Code) and options that do not qualify as incentive stock options. The exercise price of each option will be determined by the Compensation Committee, provided that the price cannot be less than 100% of the fair market value of the shares of common stock on the date on which the option is granted (or 110% of the shares’ fair market value on the grant date in the case of an incentive stock option granted to an individual who is a “ten percent stockholder” under Sections 422 and 424 of the Code). The exercise price for any option is generally payable in cash, by certified check, by tendering shares of common stock (or attestation of ownership of shares of common stock) with an aggregate fair market value on the date on which the option is exercised, equal to the exercise price, by broker-assisted cashless exercise, or in such other form acceptable to the Compensation Committee. The term of an option cannot exceed ten years from the date of grant (or five years in the case of an incentive stock option granted to a “ten percent stockholder”).
Stock Awards
The 2024 Plan also provides for the grant of stock awards. A stock award is an award of shares of common stock that will be subject to restrictions on transferability and other restrictions as the Compensation Committee determines in its sole discretion on the date of grant. The restrictions, if any, may lapse over a specified period of time or through the satisfaction of conditions as the Compensation Committee may determine. A participant who receives a stock award will have all of the rights of a stockholder as to those shares, including, without limitation, the right to vote and the right to receive dividends or distributions on the shares; provided, however, that if the stock award does not vest solely on account of continued employment or service, any dividends payable on the shares will be accumulated and paid to the participant when, and only to the extent that, the underlying stock award is earned and becomes vested. During the period, if any, when stock awards are non-transferable or forfeitable, (i) a participant is prohibited from selling, transferring, pledging, exchanging, hypothecating or otherwise disposing of his or her stock award shares, (ii) the company will retain custody of the certificates and (iii) a participant must deliver a stock power to the company for each stock award.
15
Stock Appreciation Rights
The 2024 Plan authorizes the grant of stock appreciation rights. A stock appreciation right provides the recipient with the right to receive, upon exercise of the stock appreciation right, cash, shares of common stock or a combination of the two. The amount that the recipient will receive upon exercise of the stock appreciation right generally will equal the excess of the fair market value of the shares of common stock on the date of exercise over the shares’ fair market value on the date of grant. Stock appreciation rights will become exercisable in accordance with terms determined by the Compensation Committee. Stock appreciation rights may be granted in tandem with an option grant or as independent grants. The term of a stock appreciation right cannot exceed ten years from the date of grant or five years in the case of a stock appreciation right granted in tandem with an incentive share option awarded to a “ten percent stockholder.”
Performance Units
The 2024 Plan also authorizes the grant of performance units. Performance units represent the participant’s right to receive an amount stated with reference to a specific or determinable number of shares of common stock, if performance objectives are met. The Compensation Committee will determine the applicable performance period, the performance goals and such other conditions that apply to the performance unit.If the performance goals are met, performance units will be paid in cash, shares of common stock or a combination thereof.
Other Equity-Based Awards; Long Term Incentive Plan ("LTIP") Units
The Compensation Committee may grant other types of stock-based awards as other equity-based awards under the 2024Plan, including LTIP units. Other equity-based awards are payable in cash, shares of common stock or other equity, or a combination thereof, as determined by the Compensation Committee. The terms and conditions of other equity-based awards are determined by the Compensation Committee.
LTIP units are a special class of partnership interest in our operating partnership. Each LTIP unit awarded will be deemed equivalent to an award of one share of common stock under the Amended Equity Plan, reducing the plan’s share authorization for other awards on a one-for-one basis. We will not receive a tax deduction for the value of any LTIP units granted to our employees. The vesting period for any LTIP units, if any, will be determined at the time of issuance. LTIP units, whether vested or not, will receive the same quarterly per unit distributions as OP units, which distributions will generally equal per share distributions on our shares of common stock. This treatment with respect to quarterly distributions is similar to the expected treatment of our stock awards that have time-based vesting, which will generally receive full dividends whether vested or not. Initially, LTIP units will not have full parity with common units of limited partnership in our Operating partnership ("OP Units") with respect to liquidating distributions. Under the terms of the LTIP units, our operating partnership will revalue its assets upon the occurrence of certain specified events, and any increase in our operating partnership’s in valuation from the time of grant until such event will be allocated first to the holders of LTIP units to equalize the capital accounts of such holders with the capital accounts of OP unit holders. Upon equalization of the capital accounts of the holders of LTIP units with the other holders of OP units, the LTIP units will achieve full parity with OP units for all purposes, including with respect to liquidating distributions. If such parity is reached, vested LTIP units may be converted into an equal number of OP units at any time, and thereafter enjoy all the rights of OP units, including redemption/exchange rights. However, there are circumstances under which such parity would not be reached. Until and unless such parity is reached, the value that a holder of LTIP units will realize for a given number of vested LTIP units will be less than the value of an equal number of our shares of common stock.
Incentive Awards
The 2024 Plan also permits the grant of incentive awards. An incentive award represents the right to earn a payment upon the terms and conditions prescribed by the Compensation Committee. If an incentive award is earned, the amount payable will be paid in cash, shares of common stock or a combination thereof.
16
Dividend Equivalents
The Compensation Committee may grant dividend equivalents in connection with the grant of performance units and other equity-based awards. Dividend equivalents afford the participant the right, subject to the terms and conditions prescribed by the Compensation Committee, to receive (or have credited) cash, shares or other property in amounts equivalent to the cash, shares or other property dividends declared on shares of common stock with respect to specified Performance Units or units denominated in shares of common stock or other Company securities subject to an Other Equity-Based Award, as determined by the Compensation Committee, in its sole discretion.Dividend equivalents payable on a Performance Unit award or units denominated in shares of Common Stock or other Company securities subject to an Other Equity-Based Award that does not become non-forfeitable solely on the basis of continued employment or service shall be accumulated and distributed, without interest, only when, and to the extent that, the underlying award is vested or earned.The Committee may provide that dividend equivalents (if any) shall be deemed to have been reinvested in additional shares of Common Stock or otherwise reinvested.
Change in Control
If we experience a change in control, the Compensation Committee may, at its discretion, provide that all outstanding options, stock appreciation rights, stock awards, performance units, or other equity-based awards that are not exercised prior to the change in control will be assumed by the surviving entity, or will be replaced by a comparable substitute award of substantially equal value granted by the surviving entity. The Compensation Committee may also provide that, unless assumed or replaced, all outstanding options and stock appreciation rights will be fully exercisable on the change in control, restrictions and conditions on outstanding stock awards will lapse upon the change in control and performance units or other equity-based awards will become earned in their entirety. The Compensation Committee may also provide that, unless the award is assumed or replaced, participants must surrender their outstanding options and stock appreciation rights, stock awards, performance units, and other equity based awards in exchange for a payment, in cash or our shares of common stock or other securities or consideration received by stockholders in the change in control transaction, equal to the value received by stockholders in the change in control transaction (or, in the case of options and stock appreciation rights, the amount by which that transaction value exceeds the exercise price).
In summary, a change of control under the 2024 Plan occurs if:
•a person, entity or affiliated group (with certain exceptions) acquires, in a transaction or series of transactions, more than 50% of the total combined voting power of our outstanding securities;
•we merge into another entity unless the holders of our voting securities immediately prior to the merger have more than 50% of the combined voting power of the securities in the merged entity or its parent;
•we sell or dispose of all or substantially all of our assets;
•we are liquidated or dissolved; or
•during any period of two consecutive years individuals who, at the beginning of such period, constitute our Board together with any new directors (other than individuals who become directors in connection with certain transactions or election contests) cease for any reason to constitute a majority of our Board.
The Code has special rules that apply to “parachute payments,” i.e., compensation or benefits the payment of which is contingent upon a change in control. If certain individuals receive parachute payments in excess of a safe harbor amount prescribed by the Code, the payor is denied a federal income tax deduction for a portion of the payments and the recipient must pay a 20% excise tax, in addition to income tax, on a portion of the payments.
If we experience a change in control, benefits provided under the 2024 Plan could be treated as parachute payments. In that event, the 2024 Plan provides that the plan benefits, and all other parachute payments provided under other plans and agreements, will be reduced to the safe harbor amount, i.e., the maximum amount that may be paid without excise tax liability or loss of deduction, if the reduction allows the recipient to receive greater after-tax benefits. The benefits under the 2024 Plan and other plans and agreements will not be reduced, however, if the recipient will receive greater after-tax benefits (taking into account the 20% excise tax payable by the recipient) by receiving the total benefits. The 2024 Plan also provides that these provisions do not apply to a participant who has an agreement with us providing that the individual cannot receive parachute payments that exceed the safe harbor amount.
17
Amendment; Termination
The Board may amend or terminate the 2024 Plan from time to time; provided, however, that no amendment may become effective until stockholder approval is obtained if (i) the amendment materially increases the aggregate number of shares of Common Stock that may be issued under the 2024 Plan, or (ii) the amendment is required to be approved by stockholders by the requirements of applicable law or under the New York Stock Exchange’s stockholder approval rules.For the avoidance of doubt, the Board may not without the approval of stockholders (a) reduce the option price per share of an outstanding option or the initial value of an outstanding stock appreciation right, (b) cancel an outstanding option or SAR in exchange for the grant of a new option or SAR with a lower option price per share or initial value, (c) cancel an outstanding option or outstanding SAR when the option price per or initial value, as applicable, exceeds the fair market value of our common stock in exchange for cash or other awards or (d) take any other action with respect to an outstanding option or an outstanding stock appreciation right that may be treated as a re-pricing of the award under the rules and regulations of the New York Stock Exchange.No amendment shall, without a participant’s consent, adversely affect any rights of such participant under any outstanding award of performance shares, or under any stock award, option or stock appreciation right outstanding at the time such amendment is made.
Clawback
Awards under the 2024 Plan are subject to the Company's Policy for Recovery of Erroneously Awarded Compensation ("Clawback Policy"). Under the Clawback Policy, if the Company is required to prepare an accounting restatement due to any material noncompliance with financial reporting requirements under applicable securities laws, we will be required to recover from current and former executive officers any incentive-based compensation that was erroneously paid, earned or provided to the executive officers during the three years preceding the date that the Company is required to prepare such restatement, unless the Compensation Committee determines that recovery would be impracticable. Incentive-based compensation includes compensation that is granted, earned, or vested based wholly or in part on a financial reporting measure.
If recovery is triggered under the Clawback Policy due to an accounting restatement, we are required to recover the excess amount of incentive-based compensation actually received by the executive officer over the amount of incentive-based compensation that he or she would have received had payment been determined based on the restated financial measure, regardless of whether the executive officer engaged in misconduct or otherwise caused or contributed to the requirement. In addition, the Clawback Policy permits recovery of incentive-based compensation, compensation earned based on performance goals that do not relate to any financial reporting measure(s) and/or cash or equity awards that vest based solely on service (time-based awards) from current and former executive officers that the Compensation Committee determines engaged in misconduct related to such a restatement.
Duration
No award may be granted under the 2024 Plan after the tenth anniversary of the Effective Date.
Certain Material U.S. Federal Income Tax Consequences
The following is a general summary under current law of the principal United States federal income tax consequences related to awards under the 2024 Plan. This summary deals with the general federal income tax principles that apply and is provided only for general information. Some kinds of taxes, such as state, local and foreign income taxes and federal employment taxes, are not discussed. This summary is not intended as tax advice to participants, who should consult their own tax advisors.
Incentive Stock Options. An option holder recognizes no taxable income for regular income tax purposes as a result of the grant or exercise of an incentive stock option. Option holders who neither dispose of their shares within two years following the grant of the incentive stock option nor within one year following its exercise will normally recognize a capital gain or loss upon a sale of the shares equal to the difference, if any, between the sale price and the exercise price of the option. If an option holder satisfies the holding periods, the Company will not be entitled to any federal income tax deduction with respect to the option. If an option holder disposes of shares within two years after the date of grant or within one year after the date of exercise (a “Disqualifying Disposition”), the difference between the fair market value of the shares on the exercise date and the exercise price (not to exceed the gain realized on the sale if the disposition is a transaction with respect to which a loss, if sustained, would be recognized) will be taxed as ordinary income at the time of disposition. Any gain in excess of that amount will be a capital gain. In the event of a Disqualifying Disposition the Company may claim a federal income tax deduction equal to the amount of ordinary income recognized by the option holder.
18
Nonqualified Stock Options and Stock Appreciation Rights. Options not designated or qualifying as incentive stock options will be nonqualified stock options. An optionholder generally recognizes no taxable income as the result of the grant of such an option. Upon exercise of a nonqualified stock option, the optionholder normally recognizes ordinary income in the amount of the excess of the fair market value of the shares on the exercise date over the option exercise price. If the optionholder is an employee, such ordinary income generally is subject to withholding of income and employment taxes. Upon the sale of shares acquired under a nonqualified stock option, any gain or loss, based on the difference between the sale price and the fair market value on the exercise date, will be taxed as a capital gain or loss. No tax deduction is available to our Company with respect to the grant of a nonqualified stock option or the sale of the shares acquired pursuant to such grant. We generally should be entitled to a deduction equal to the amount of ordinary income recognized by the optionholder as a result of the exercise of a nonqualified stock option. Stock Appreciation Rights are taxed and deductible in substantially the same manner as nonqualified stock options.
Other Awards. The current federal income tax consequences of stock awards, performance units, dividend equivalents, cash awards and other stock awards authorized under the 2024 Plan (other than LTIP units) generally follow certain basic patterns; nontransferable stock awards subject to a substantial risk of forfeiture result in income recognition equal to the excess of the fair market value over the price paid, if any, only at the time the restrictions lapse (unless the recipient elects to accelerate recognition as of the date of grant through a Code Section 83(b) election, in which case ordinary income is recognized on the date of grant in an amount equal to the excess of the fair market value of the shares on the date of grant over the price paid, if any); performance stock units, dividend equivalents and cash awards and other stock awards are generally subject to tax at the time of payment. We or our subsidiaries or affiliates generally should be entitled to a federal income tax deduction at the time and for the same amount as the participant recognizes ordinary income.
Section 409A of the Code. Certain types of awards under the 2024 Plan may constitute, or provide for, a deferral of compensation subject to Section 409A of the Code. Unless certain requirements set forth in Section 409A of the Code are complied with, holders of such awards may be taxed earlier than would otherwise be the case (e.g., at the time of vesting instead of the time of payment) and may be subject to an additional 20% penalty tax (and, potentially, certain interest, penalties and additional state taxes). To the extent applicable, the 2024 Plan and awards granted under the 2024 Plan are generally intended to be structured and interpreted in a manner intended to either comply with or be exempt from Section 409A of the Code and the Department of Treasury regulations and other interpretive guidance that may be issued under Section 409A of the Code.
New Plan Benefits
Other than pursuant to the terms of the Company's director compensation program, the Company is unable to estimate or describe the awards that may be granted under the 2024 Plan (if approved by the stockholders) because the Compensation Committee or the Board, in their sole discretion, will determine the awards that may be granted during the term of the 2024 Plan.
| Name and Position | Dollar Value (S)(1) | Number of Shares (#) | ||||||||||||
| Jonathan P. Stanner, Director, President and Chief Executive Officer | $ | — | — | |||||||||||
| William H. Conkling, Executive Vice President and Chief Financial Officer | — | — | ||||||||||||
| Christopher R. Eng, Executive Vice President, General Counsel, Chief Risk Officer and Secretary | — | — | ||||||||||||
| Paul Ruiz, Senior Vice President and Chief Accounting Officer | — | — | ||||||||||||
| Executive Group | — | — | ||||||||||||
Non-Executive Director Group (2) | 770,000 | (2) | ||||||||||||
| Non-Executive Officer Employee Group | — | — | ||||||||||||
(1) Pursuant to our director compensation program, each non-employee director serving on the Board at the Annual meeting will be granted an equity award consisting of fully-vested shares of our common stock with an aggregate value of approximately $110,000. In addition, non-employees may opt to receive their cash retainer in stock, which is not reflected in the table above.
(2) The aggregate number of shares to be granted to non-employee directors is not included in the table above as the number of shares will be determined by dividing $110,000 by the VWAP of our common stock on the NYSE for the ten trading days proceeding the grant date.
19
Recommendation:
OUR BOARD OF CONTENTSDIRECTORS UNANIMOUSLY RECOMMENDS A VOTE FOR APPROVAL OF THE SUMMIT HOTEL PROPERTIES, INC. 2024 EQUITY INCENTIVE PLAN.
20
CORPORATE GOVERNANCE PRINCIPLES AND BOARD MATTERS
The Board oversees our management and our Company’s business for the benefit of our stakeholders and in order to enhance long-term stockholder value. The Board has adopted Corporate Governance Guidelines, which are reviewed annually and periodically amended by the Board to enhance our corporate governance principles. A current copy of the Corporate Governance Guidelines can be found under “Investors — Corporate Overview — Governance Documents” on our website at www.shpreit.com.www.shpreit.com.
The Board has also adopted a Code of Business Conduct and Ethics (“Code of Ethics”) that applies to all of our directors, officers and employees. The purpose of the Code of Ethics is to promote honest and ethical conduct and to promote compliance with all applicable rules and regulations that apply to our Company and our directors, officers and employees. A current copy of the Code of Ethics can be found under “Investors — Corporate Overview — Governance Documents” on our website at www.shpreit.com.www.shpreit.com. Any waiver of the Code of Ethics with respect to our executive officers or directors may be made only by the Board or one of our Board’s committees and will be posted timely on our website.
Our Company was built on relationships with investors, lenders, investment banks, franchise brand companies and with our third-party management companies. Management strives to operate our Company with passion, integrity and excellence. We are committed to being open and transparent about our business practices and performance and remaining accountable for our conduct. We are also committed to our stockholders to create long-term value. We follow through on our commitment to stockholders by implementing what we believe are sound corporate governance practices.
Corporate Responsibility Program
We formally established our Corporate Responsibility Program (“CRP”("CRP") in 2017 as part of our ongoing commitment to be more inclusive, equitable and sustainable. We believe that the goals and efforts established under our CRP are an important part of our core responsibilities to create a more inclusive, equitable and sustainable world. Our CRP is designed to help our stockholders better understand our commitment and efforts regarding environmental stewardship, social responsibility, governance and resilience. The Company’sCompany's Nominating and Corporate Governance Committee provides oversight and direction to management on the reporting and goals contained in our CRP.CRP, as well as climate and other environmental, social and governance (“ESG”) related risks. We have based our corporate responsibility goals using the United Nations Sustainable Development Goals as a guide with a focus on those that best align with our business. Since the establishment of our CRP, we have built upon our sustainability objectives, from tracking metrics related to our consumption, waste, recycling and greenhouse gas emissions, to setting measurable, science-basedscience-informed reduction targets for energy, water and carbon. We are working to improve the efficiency of our buildings and promote sustainable operations through our energy management program. We also formed a 501(c)(3) nonprofit organization to support our community and social programs. We are pleased with the significant progress that we have made with our CRP and look forward to continuing to build on our accomplishments. A current copy of our Corporate Responsibility Report can be found under “Responsibility — About — Download Corporate Responsibility Report” on our website at www.shpreit.com.www.shpreit.com. Neither our Corporate Responsibility ReportCRP nor any of the disclosures otherwise included on our website are incorporated by reference into this proxy statement or any other Company filing under the Securities Act of 1933, as amended, or the Securities Exchange ActAct. Additionally, disclosures related to our CRP or other ESG efforts are not necessarily “material” under the federal securities law for our reporting or operations but are instead informed by various ESG standards and frameworks and the interests of 1934, as amended.various stakeholders. Much of this information is subject to assumptions, estimates or third-party information that is still evolving and subject to change, including some factors which may be beyond our control.
Stockholder Right to Amend Bylaws
Stockholders of the Company have the right to amend certain Articles of the Bylaws by the affirmative vote of the holders of a majority of the outstanding shares of common stock pursuant to a binding proposal properly submitted to the stockholders for approval at duly called annual or special meetings of stockholders by any stockholder that satisfies the ownership requirements specified in Rule 14(a)-8 under the Exchange Act of 1934, as amended.Act.
21
Stock Ownership Guidelines
Based on current corporate governance standards, the Board believes all non-employee directors and certain key executive officers should own a meaningful equity interest in our Company to align the interests
of directors and executive officers more closely with those of stockholders. Accordingly, the Board has adopted stock ownership guidelines for key executive officers and all non-employee directors.
For purposes of these guidelines, the term “Company common stock” includes, in addition to shares of our common stock, (a) any class of equity securities issued by our operating partnership, Summit Hotel OP, LP (the “Operating Partnership”), that are redeemable for shares of our common stock, whether held directly or indirectly, or by or for the benefit of, immediate family members, and (b) vested and unvested restricted shares of common stock, but excludes (x) stock options, whether exercisable or un-exercisable, (y) unearned performance-based restricted stock and (z) warrants and all other forms of derivative securities.
The Board reviews the minimum equity holdings guidelines for key executive officers on a periodic basis to ensure the guidelines remain consistent with corporate governance best practices and continue to promote the alignment of executive and stockholder interests.
Over time, certain key executive officers are required to hold Company common stock with a value equal to a multiple of their then-current base salary. The equity ownership value for each of these executive officers will be calculated by multiplying the number of shares of Company common stock owned by the trailing ten-trading day volume weighted average price (“VWAP”) of our common stock prior to the date of computation, typically at the end of the fiscal year. The executive officers named in the table below except Mr. Stanner because he was appointed President and Chief Executive Officer effective January 15, 2021, currently hold stock with values at or in excess of the required level. Mr. Stanner has until January 15, 2026 to achieve stock ownership at the required level. The equity ownership requirements for our key executive officers are as follows:
| Name | Multiple of Base Salary | ||||||||||||
| Jonathan P. Stanner, President and Chief Executive Officer | 6x | ||||||||||||
| William H. Conkling, EVP and Chief Financial Officer | 2x | ||||||||||||
| Christopher R. Eng, EVP, General Counsel & Chief Risk Officer | 1x | ||||||||||||
| Paul Ruiz, SVP & Chief Accounting Officer | 1x | ||||||||||||
Each non-employee director is required to hold a number of shares of Company common stock equal to five times his or her annual cash retainer. The equity ownership value for each non-employee director will be calculated by multiplying the number of shares of Company common stock owned by the trailing ten tradingten-trading day VWAP of our common stock prior to the date of computation, typically at the end of the fiscal year. Until such time as the required ownership level is achieved, each non-employee director is required to retain at least fifty percent (50%) of the net after-tax profit shares from the vesting of equity awards. The Board reviews the minimum equity holdings guidelines for non-employee directors on a periodic basis to ensure the guidelines remain consistent with corporate governance best practices.
Board of Directors Structure & Practices
•
Our Chairman of the Board is independent.
•
Twenty-five percent (25%) of our director nominees are female.
•
Eighty-eight percent (88%) of our director nominees are independent.
•
Thoughtful Board refreshment led by the Nominating and Corporate Governance Committee, with three independent directors from gender/racially/ethnically underrepresented groups added since 2017.
•
Three fully independent Board committees —– Audit, Compensation and Nominating and Corporate Governance.
•
All Audit Committee members are “audit committee financial experts”.experts.”
22
•
All of our directors must be elected annually by majority vote standard.
•
Our directors are subject to a director resignation policy with respect to uncontested elections (see “The Board of Directors and Its Committees — Policy on Voting Regarding Directors” below).
•
No shareholder rights plan (Poison Pill) implemented.
•
Annual self-evaluations of the performance of each individual director,directors, each Committee and the Board as a whole.
•
Our independent directors meet regularly without the presence of any of our officers or employees.
Stockholder Engagement and Investor Outreach Program
The Board is highly engaged in the Company’sCompany's strategic planning and performance. To that end, building and maintaining long-term relationships with our stockholders is a core goal of the Company. Both management and the Board believe that stockholder engagement is a year-round priority and are committed to both proactive and reactive engagement. Management frequently conducts calls, holds meetings or conducts property tours with our large stockholders. In doing so, we provide a forum for discussions and feedback regarding the long-term value creation strategy of the Company. In 2021,2023, management engaged with a majority of our largest institutional stockholders. These and other engagements prove invaluable as a way to promote two-way communication with our stockholders regarding the Company’sCompany's strategic vision for value creation, confirming the value of our stockholder-friendly governance structures and our approach to corporate responsibility.
Anti-Hedging and Anti-Pledging Policies
The Board has adopted an insider trading policy that contains restrictions on hedging and pledging securities issued by us or our Operating Partnership. With respect to hedging, directors and executive officers are prohibited from engaging in any hedging or monetization transactions involving securities issued by us or our Operating Partnership. With respect to pledging, directors and executive officers are prohibited from holding securities issued by us or our Operating Partnership in a margin account or pledging these securities as collateral for a loan. An exception to this anti-pledging policy may be granted if a director or executive officer desires to pledge securities issued by us or our Operating Partnership as collateral for a loan other than margin debt and clearly demonstrates the financial capacity to repay the loan without resort to the pledged securities. Any permitted pledge of securities must be pre-approved by our Chief Executive Officer and our General Counsel. No director or executive officer has pledged securities as collateral for a loan.
Compensation Clawback Policy
In light of rules issued by the SEC in 2023, effective as of October 2, 2023, the Board has adopted aan updated compensation clawback policy that contains terms("Clawback Policy"), which is intended to ensure that executives are not unduly enriched by payment of incentives based on financial achievements that are later requiredcomply with the NYSE listing standards adopted pursuant to be restated. If ourRule 10D-1 under the Exchange Act. Under the Clawback Policy, if the Company is required to restate its audited, consolidated financial resultsprepare an accounting restatement due to any material non-compliancenoncompliance with financial reporting requirements under applicable securities laws, as a result of misconduct, fraudwe will be required to recover from current and former executive officers any incentive-based compensation that was erroneously paid or negligence as determined inprovided to the Board’s sole discretion, each executive officers during the three years preceding the date that the Company is required to prepare such restatement, unless the Compensation Committee determines that recovery would be impracticable. Incentive-based compensation includes compensation that is deemed responsible, as determinedgranted, earned, or vested based wholly or in part on a financial reporting measure.
If recovery is triggered under the Board’s sole discretion while taking into consideration all facts and circumstances shall reimburseClawback Policy due to an accounting restatement, we are required to recover the Company up to the fullexcess amount of incentive-based compensation actually received by the after-tax valueexecutive officer over the amount of the incentiveincentive-based compensation that he or she would not have received had payment been earned ifdetermined based on the restated financial information had been accurately reported initially.measure, regardless of whether the executive officer engaged in misconduct or otherwise caused or contributed to the requirement. In addition, the Board may withholdClawback Policy permits recovery of incentive-based compensation, compensation earned based on performance goals that do not relate to any financial reporting measure(s) and/or cash or equity awards that vest based solely on service (time-based awards) from those executives deemed non-responsible for a restatement, future awards with equivalent value tocurrent and former executive officers that of the after-tax value of the awards initially madeCompensation Committee determines engaged in misconduct related to such executive on the basis of the restated financial results, but only to the extent such awards were made within the preceding 24 months.a restatement.
23
Succession Planning
The Board, with input from the Nominating and Corporate Governance Committee, regularly reviews our succession plan for the Chief Executive Officer, other executive officers and key employees, to ensure that an appropriate plan is in place for those occurrences that might result in a vacancy in the position of Chief Executive Officer or other management positions.
24
THE BOARD OF DIRECTORS AND ITS COMMITTEES
We are managed under the direction of our Board. As of March 30, 2022,April 3, 2024, our directors are: Amina Belouizdad, Daniel P. Hansen, Dr. Bjorn R. L. Hanson, Jeffrey W. Jones, Kenneth J. Kay, MehulMehulkumar B. Patel, Amina Belouizdad Porter, Jonathan P. Stanner, Thomas W. Storey and Hope S. Taitz. Mr. Jones is the Chairman of the Board. As previously reported on Form 8-K filed by the Company on December 7, 2021, Mr. Hansen’s tenure as a director will end in conjunction with our 2022 annual meeting. Each of our directors stands for election annually.
Board Refreshment
The Board and the Nominating and Corporate Governance Committee believe it is important for the Board to be refreshed by adding new directors from time to time. In 2021, the Board actively explored adding a new director. The Nominating and Corporate Governance Committee conducted a broad search that went beyond traditional candidate pools and purposely considered candidates that possessed key characteristics, including diversity traits, unique skills and new perspectives that could best perpetuate the success of the Company and contribute to the overall effectiveness of the Board. Effective May 13, 2021, Ms. Amina Belouizdad Porter was appointed to the Board as an independent director and currently sits on our Nominating and Corporate Governance Committee and our Compensation Committee.Committees. In addition, on January 13, 2022, upon substantial completion of the Company’s acquisition of a 27-property portfolio from NewcrestImage Holdings, LLC (“NewcrestImage”), Mr. MehulMehulkumar Patel was appointed to the Board as an independent director.director in accordance with a Director Nomination Agreement. See “Certain Relationships and Related Transactions” in this proxy statement for more detail.
Director Independence of Directors
Our Corporate Governance Guidelines require that a majority of our directors be “independent,” with independence determined in accordance with the applicable standards of the NYSE. The Board may determine a director to be independent if the Board has affirmatively determined that the director has no material relationship with us or our subsidiaries, either directly, or as a stockholder, director, officer or employee of an organization that has a relationship with us or our subsidiaries. The Board has determined that Ms. Belouizdad, Dr. Hanson, Mr. Jones, Mr. Kay, Mr. Patel, Ms. Belouizdad Porter, Mr. Storey and Ms. Taitz have no material relationship with us or our subsidiaries and therefore, are independent under the applicable standards of the NYSE. As a result, a majority of our directors are independent. Mr. Stanner serves as an executive officer and is not considered independent under the applicable standards of the NYSE.
Committees
The Board has established an Audit Committee, Compensation Committee and Nominating and Corporate Governance Committee, and has adopted a written charter for each committee. A copy of each committee charter is available on our website at www.shpreit.com under the heading “Investors —– Corporate Overview —– Governance Documents.”
Audit Committee
The members of the Audit Committee are Mr. Jones (Chair), Dr. Hanson, Mr. Kay and Ms. Taitz. Each member has been determined to be “independent” within the meaning of the applicable standards of the NYSE and Rule 10A-3 of the Exchange Act. In addition, each member meets the financial literacy requirements for audit committee membership under the NYSE’s rules and the rules and regulations of the SEC. The Board has determined that Mr. Jones, Dr. Hanson, Mr. Kay and Ms. Taitz each is an “audit committee financial expert” as such term is defined in Item 407(d)(5)(ii) of Regulation S-K.
The Audit Committee is responsible for reviewing and discussing with management and our independent public accountants our annual and quarterly financial statements, engaging independent public accountants, reviewing with the independent public accountants the plans and results of the audit engagement, approving professional services provided by the independent public accountants, reviewing the performance and independence of the independent public accountants, pre-approving audit and non-audit fees and reviewing the adequacy of our internal accounting controls, our internal audit functions and Sarbanes-Oxley Act compliance. The Audit Committee has the power to investigate any matter brought to its attention within the scope of its duties and to retain counsel or outside advisors for this purpose where appropriate. The Audit
Committee is responsible for monitoring our procedures for compliance with the rules for taxation as a real estate investment trust (“REIT”) under Sections 856-860 of the Internal Revenue Code of 1986, as amended (“Internal Revenue Code”). Additionally, the Audit Committee is responsible for monitoring information security risk and information security risk policies and procedures.
25
Compensation Committee
The members of the Compensation Committee are Mr. Kay (Chair), Mr. Jones, Ms. Belouizdad Mr. JonesPorter and Mr. Storey. Each member has been determined to be “independent” within the meaning of the applicable standards of the NYSE. Each member of the Compensation Committee qualifies as a “non-employee director” for purposes of Rule 16b-3 of the Exchange Act.
The Compensation Committee exercises all powers delegated to it by the Board in connection with compensation matters. The Compensation Committee is responsible for the review and approval of the compensation and benefits of our executive officers and directors, administration and recommendations to the Board regarding our compensation and long-term incentive plans, and production of the annual reports on executive compensation for inclusion in our proxy statements. In connection with those responsibilities, the Compensation Committee has the sole authority to retain and terminate compensation consultants employed by it to help evaluate our compensation programs. The Compensation Committee also has authority to grant awards under the Company’s 2011 Equity Incentive Plan as Amended and Restated (“Equity Incentive(the “2011 Plan”).
Nominating and Corporate Governance Committee
The members of the Nominating and Corporate Governance Committee are Ms. Taitz (Chair), Dr. Hanson, Ms. Belouizdad Dr. HansonPorter and Mr. Storey. Each member has been determined to be “independent” within the meaning of the applicable standards of the NYSE.
The Nominating and Corporate Governance Committee is responsible for monitoring our compliance with corporate governance requirements of state and federal law, and the rules and regulations of the NYSE; developing and recommending to the Board criteria for prospective members of the Board; conducting Board candidate searches and interviews; overseeing and evaluating the Board and management; monitoring compliance with our Code of Ethics and policies with respect to conflicts of interest; reviewing and approving interested transactions pursuant to our related party transaction policy; periodically evaluating the appropriate size and composition of the Board, recommending, as appropriate, increases, decreases and changes in the composition of the Board; formally proposing the slate of nominees for election as directors at each annual meeting of our stockholders; and providing oversight and guidance for the Company’sCompany's Corporate Responsibility Program. In addition, thisthe committee annually facilitates the evaluation of the performance of each individual director,directors, each Committee and the Board as a whole.
Compensation Committee Interlocks and Insider Participation
The Compensation Committee consists of Ms. Belouizdad, Mr. Jones, Mr. Kay, Ms. Belouizdad Porter and Mr. Storey. No member of the Compensation Committee is or has been an employee or officer of the Company. None of our executive officers currently serves, or during the past fiscal year has served, as a member of the board of directors or compensation committee of another entity that has one or more executive officers serving on our Board or Compensation Committee.
Board Leadership Structure
The Board believes it is important to retain the flexibility to allocate the responsibilities of the positions of the Chairman of the Board and the Chief Executive Officer in the way it believes is in the Company’s best interest. Currently, the Board believes that it is in the Company’s best interest to separate these positions. Mr. Jones, an independent director, currently serves as our Chairman of the Board and was appointed to the position effective January 1, 2022. Prior to serving as our non-executive Chairman of the Board, Mr. Jones was our Lead Independent Director. Mr. Stanner is currently our President and Chief Executive Officer and was appointed to those positions effective January 15, 2021.
26
Risk Management Oversight
One of the key functions of our Board is informed oversight of our risk management process as well as strategic risks of the Company.Company's risk profile. At least annually, the Company’sCompany's executive officers or employees responsible for the Company’sCompany's day-to-day risk management practices present to the Board a comprehensive report on the material risks to the Company, including information security matters. At such times, the management team also reviews with the Board the Company’sCompany's risk mitigation policies and strategies specific to each risk identified. Throughout the year, management monitors the Company’sCompany's risk profile and updates the Board as new material risks are identified or the aspects of a risk previously identified materially change. The Board recognizes that it is neither possible nor prudent to eliminate all risk and believes that assumption of certain risk is inherent for the Company to be competitive and to achieve its business objectives. Our Board administers this oversight primarily through the Audit Committee but also through the other committees of the Board or the Board itself, as appropriate.
Meetings and Attendance
In 2021, as a result of travel and other restrictions stemming from the COVID-19 pandemic,2023, the Board met twicefour times in person and eightfour times telephonically,via video teleconference, the Audit Committee met twicefour times in person and fivethree times telephonically,via video teleconference, the Compensation Committee met twicefour times in person, and twice telephonically, and the Nominating and Corporate Governance Committee met twicefour times in person and twice telephonically.person. Each of our currently serving directors attended at least 75% of the aggregate meetings of the Board and the committees of the Board on which he or she served during 2021.2023.
Executive Sessions of Our Independent Directors
As required by the NYSE rules, the non-employee directors, all of whom are independent under the applicable standards of the NYSE, regularly meet in executive session, without management present. Generally, these executive sessions follow regularly scheduled meetings of the Board and the three standing committees. The independent, non-employee directors met in executive session following scheduled meetings in 2021.2023. Mr. Jones presided over the executive sessions of the Board, and the respective Chair of each committee presided over each such committee’s executive sessions.
Director Nominations
Before each annual meeting of stockholders, the Nominating and Corporate Governance Committee considers the nomination of all directors who are up for election at the next annual meeting of stockholders and also considers new candidates whenever there is a vacancy on the Board, or whenever a vacancy is anticipated due to a change in the size or composition of the Board, a retirement of a director or for any other reason. In addition to considering incumbent directors, the Nominating and Corporate Governance Committee may identify director candidates based on recommendations from directors, stockholders, management and others.
The Nominating and Corporate Governance Committee works with the Board to determine the appropriate characteristics, skills and experience for the Board as a whole and its individual members. In evaluating the suitability of individuals for Board membership, the Nominating and Corporate Governance Committee considers many factors, including, but not limited to:
•whether the individual meets the requirements for independence;
•
the individual’s general understanding of the various disciplines relevant to the success of a publicly traded company in today’s business environment;
•
the individual’s understanding of the Company’s business;
•
the individual’s professional expertise and educational background; and
•
other factors that promote diversity, equity and inclusion.
The Nominating and Corporate Governance Committee evaluates each individual in the context of the Board as a whole, with the objective of recommending a group of directors that can best perpetuate the
success of our business and represent stockholder interests through the exercise of sound judgment, using its diversity of experience. In determining whether to recommend a director for re-election, the Nominating and Corporate Governance Committee also considers the director’s past attendance at meetings and participation in and contributions to the activities of the Board.
27
We have already achieved significant success in diversity in our Board’s composition with currently over 40% of our non-employee directors being gender and/or ethnically diverse with the Chair of our Nominating and Corporate Governance Committee being gender diverse. In the future, the Nominating and Corporate Governance Committee will strongly consider additional gender and/or ethnically diverse individuals when considering candidates to fill any vacancy or similar new position on the Board. Thus, although we do not have a formal policy about diversity of Board membership, butour Nominating and Corporate Governance Committee understands the importance of a diversity of perspectives and experiences to a healthy board culture. The Nominating and Corporate Governance Committee considers a broad range of factors when considering and nominating director candidates to the Board, including differences of viewpoint, professional experience, education, skill, other personal qualities and attributes, race,including race/ethnicity, gender identity and expression and national origin. The Nominating and Corporate Governance Committee neither includes nor excludes any candidate from consideration solely based on the candidate’s demographic background or other diversity traits.considerations.
For purposes of the 20232025 annual meeting of stockholders, the Nominating and Corporate Governance Committee will consider appropriate nominees for directors whose names are submitted in writing by a stockholder. Refer to “Requirements for Proposals Not Intended for Inclusion in Proxy Materials; Director Nominations”, in this proxy statement for more detail. Subject to the discretion of the Nominating and Corporate Governance Committee, we anticipate that any director candidates submitted to us by our stockholders will be evaluated by the Nominating and Corporate Governance Committee on the same basis as any other director.
Policy on Voting Regarding Directors
The Board has adopted a policy on voting regarding directors. Under the policy, at any meeting of stockholders at which members of the Board are to be elected by the stockholders in an uncontested election, any nominee for director who receives a greater number of votes “against” his or her election than votes “for” his or her election will submit to the Board a written offer to resign from the Board no later than two weeks after the certification of the voting results. An uncontested election is one in which the number of individuals who have been nominated for election as a director is equal to, or less than, the number of directors to be elected.
The Nominating and Corporate Governance Committee will consider the resignation offer and, within 60 days after the certification of the voting results, recommend to the Board whether to accept or reject the resignation offer. In determining its recommendation to the Board, the Nominating and Corporate Governance Committee will consider all factors it deems relevant, which may include, (i) any stated reason or reasons why stockholders cast votes “against” for the director, (ii) the qualifications of the director, and (iii) whether the director’s resignation from the Board would be in our best interests and the best interests of our stockholders. The Nominating and Corporate Governance Committee may also consider alternatives to acceptance or rejection of the resignation offer as the Nominating and Corporate Governance Committee members deem appropriate.
The Board will act on the Nominating and Corporate Governance Committee’s recommendation no later than 90 days after the certification of the voting results. The Board will consider the information, factors and alternatives considered by the Nominating and Corporate Governance Committee and additional information, factors and alternatives the Board deems relevant. The recommendation of the Nominating and Corporate Governance Committee will not be binding on the Board.
Any director who offers to resign as provided above will not participate in the Nominating and Corporate Governance Committee’s or the Board’s consideration of whether to accept his or her resignation offer.
If a director’s resignation offer is accepted by the Board, the Nominating and Corporate Governance Committee will recommend to the Board whether to fill the vacancy created by such resignation or to reduce the number of directors constituting the Board.
If a majority of the members of the Nominating and Corporate Governance Committee were required to offer their resignations, the remaining independent directors will appoint a special committee of the Board to consider the resignation offers and whether to accept the resignation offers.
We will publicly disclose the Board’s decision in a Current Report on Form 8-K filed with the SEC, including an explanation of the process by which the decision was made and, if applicable, the reasons for rejecting the resignation offer(s).
28
Communication with the Board
Stockholders and other interested parties who wish to communicate with the Board, including any non-employee director, or the non-employee directors as a group, or any individual director or directors, may do so by writing to the Chair of the Nominating and Corporate Governance Committee, Board of Directors of Summit Hotel Properties, Inc., 13215 Bee Cave Parkway, Suite B-300, Austin, Texas 78738. The independent, non-employee directors have procedures for the handling of communications from stockholders and other interested parties and have directed our Secretary to act as their agent in processing any communications received. All communications that relate to matters within the scope of the responsibilities of the Board and its standing committees are to be forwarded to the Chair of the Nominating and Corporate Governance Committee. Communications that relate to matters that are within the scope of the responsibilities of one of the Board’s standing committees are also to be forwarded to the chair of the appropriate committee. Communications that relate to ordinary business matters that are not within the scope of the responsibilities of the Board are to be sent to the appropriate member of management. Solicitations, junk mail and obviously frivolous or inappropriate communications will not be forwarded but will be made available to any non-employee director who wishes to review them.
Policy Governing Director Attendance at Annual Meetings of Stockholders
We expect each of our directors to attend the annual meeting unless doing so would be impracticable due to unavoidable conflicts or doing so would violate state or local rules and regulations. In 2021, as a result of travel and other restrictions stemming from the COVID-19 pandemic, all of our independent directors attended our annual meeting telephonically.
29
DIRECTOR COMPENSATION
Our philosophy is to pay non-executivenon-employee directors competitively and fairly for the work performed. The Compensation Committee annually reviews our director compensation with the assistance of its independent consultant, Frederic W. Cook & Co, Inc. (“FW Cook”), who annually conducts a competitive analysis of our non-employee director pay levels and program design versus the same peer group used in comparisons of executive compensation (see “Compensation Discussion & Analysis — Analysis—Peer Group Information”). The design of our non-executivenon-employee director compensation program reflects recognized best practices and incorporates the following provisions: retainer-only cash compensation with no fees for attending meetings, which is an expected part of board service; significant portion of total compensation in full-value equity awards, for alignment with stockholder interests, with annual grants made based on a fixed-value formula with immediate vesting, to avoid entrenchment; additional retainers for non-executive Chairman of the Board or Lead Independent Director, as applicable, Committee Chairs and committee memberships to recognize additional responsibilities and time commitment; and meaningful share ownership requirements of five times the annual cash retainer.
Directors who are our employees do not receive compensation for their services as directors. For 2021,2023, our non-employee director compensation program consisted of the items noted below.below, which remains unchanged for 2024.
•Annual Cash Retainer. The annual cash retainer was $50,000$60,000 for each non-employee director.
•
Additional Annual Committee Membership Fee. The additional annual fee for membership on each of our standing committees was as follows: $12,500 for each member of the Audit Committee, $10,000 for each member of the Compensation Committee and $7,500 for each member of the Nominating and Corporate Governance Committee.
•
Additional Annual Committee Chairperson Fee. Additional annual Committee Chairperson fees were as follows: $12,500$15,000 for the Chair of the Audit Committee, $10,000$12,500 for the Chair of the Compensation Committee and $7,500$10,000 for the Chair of the Nominating and Corporate Governance Committee.
•
Annual Lead Independent Director Fee.Non-Executive Chairman Fee. The additional annual retainer fee for the Lead Independent Director was $20,000.
•
Annual Equity Award. Following the 20212023 annual meeting of stockholders, we granted each non-employee director an equity award consisting of 10,09116,163 shares of our common stock with an aggregate value of approximately $100,000$110,000 (the number of shares awarded to each non-employee director was determined by dividing $100,000$110,000 by the VWAP of our common stock on the NYSE for the ten trading days preceding the grant date). These shares were granted on May 13, 2021,24, 2023, pursuant to our Equity Incentive2011 Plan and were fully vested on the grant date.
•
Election to Receive Stock in Lieu of Cash Fees. Non-employee directors have the option to elect to receive all or any part of the cash fees we are required to pay themfor board service in fully vested shares of our common stock issued under our Equity Incentive2011 Plan based upon the VWAP of our common stock on the NYSE for the ten trading days preceding the grant date. In 2021,2023, no director elected to receive his or her fees in shares of our common stock in lieu of cash.
We reimburse our non-employee directors for reasonable out-of-pocket expenses incurred in connection with the performance of their duties as directors, including without limitation, travel expenses in connection with their attendance at in-person board and committee meetings.
30
The table below summarizes the compensation paid by us to our non-employee directors for 2021.
| Name | | | Fees Earned or Paid in Cash ($) | | | Stock Awards ($)(1) | | | Total ($) | | |||||||||
| Amina Belouizdad* | | | | | 50,625 | | | | | | 97,176 | | | | | | 147,801 | | |
| Bjorn R. L. Hanson | | | | | 70,000 | | | | | | 97,176 | | | | | | 167,176 | | |
| Jeffrey W. Jones | | | | | 105,000 | | | | | | 97,176 | | | | | | 202,176 | | |
| Kenneth J. Kay | | | | | 82,500 | | | | | | 97,176 | | | | | | 179,676 | | |
| Thomas W. Storey | | | | | 67,500 | | | | | | 97,176 | | | | | | 164,676 | | |
| Hope S. Taitz | | | | | 77,500 | | | | | | 97,176 | | | | | | 174,676 | | |
| Name | Fees Earned or Paid in Cash ($) | Stock Awards ($)(1) | Total ($) | |||||||||||||||||
| Bjorn R. L. Hanson | $ | 80,000 | $ | 107,807 | $ | 187,807 | ||||||||||||||
| Jeffrey W. Jones | 197,500 | 107,807 | 305,307 | |||||||||||||||||
| Kenneth J. Kay | 95,000 | 107,807 | 202,807 | |||||||||||||||||
| Mehulkumar B. Patel | 60,000 | 107,807 | 167,807 | |||||||||||||||||
| Amina Belouizdad Porter | 77,500 | 107,807 | 185,307 | |||||||||||||||||
| Thomas W. Storey | 77,500 | 107,807 | 185,307 | |||||||||||||||||
| Hope S. Taitz | 90,000 | 107,807 | 197,807 | |||||||||||||||||
(1)
Amounts reflect the aggregate grant date fair value, calculated in accordance with Accounting Standards Codification (“ASC”) 718, of the stock awards granted to our non-employee directors in 2021.2023. Each non-employee director received a grant of 10,09116,163 shares of fully vested stock on May 13,24, 2023. No director currently holds any Company options, restricted stock or restricted stock units.
EXECUTIVE OFFICERS
The following table sets forth the name, position with the Company and age (as of the annual meeting) of each executive officer:
| Name, Age | Position | |||||||
| Jonathan P. Stanner, 43 | Director, President and Chief Executive Officer | |||||||
| William H. Conkling, 49 | Executive Vice President and Chief Financial Officer | |||||||
| Christopher R. Eng, 53 | Executive Vice President, General Counsel, Chief Risk Officer and Secretary | |||||||
| Paul Ruiz, 58 | Senior Vice President and Chief Accounting Officer | |||||||
The biographical descriptions below set forth certain information with respect to each executive officer, including experience, qualifications, diversity, attributes and skills.
Jonathan P. Stanner. Information regarding Mr. Stanner is described above under "Election of Directors - Board of Directors Nominees."
William H. Conkling. Mr. Conkling has served as our Executive Vice President and Chief Financial Officer since May 2021. Prior to joining Summit, Mr. Conkling served as a Managing Director in the Real Estate, Gaming & Lodging Investment Banking group for Bank of America Merrill Lynch, from July 2007 to May 2021. Prior to joining Bank of America Merrill Lynch, Mr. Conkling was with the investment banking unit of Bear Stearns & Co. and previously worked in asset management for Host Hotels & Resorts (NYSE: HST). Mr. Conkling earned a Bachelor of Science in Hotel and Restaurant Administration from the School of Hotel Administration at Cornell University and a Master of Business Administration from the Johnson Graduate School of Management at Cornell University.
Christopher R. Eng. Mr. Eng has served as an officer since our initial public offering in 2011. He currently serves as our Executive Vice President, General Counsel, Chief Risk Officer and Secretary. Mr. Eng was previously Vice President, General Counsel and Secretary of our predecessor, The Summit Group from 2004 until our initial public offering. Mr. Eng received B.A. degrees in History and English from Augustana College (n/k/a Augustana University (S.D.)) and a J.D. degree from the University of Denver College of Law (n/k/a Sturm College of Law).
31
COMPENSATION DISCUSSION AND ANALYSIS
This Compensation Discussion and Analysis (“CD&A”) provides you with information onregarding the Company’s executive compensation programs and practices, and the decisions that the Compensation Committee has made under the program. This CD&A focuses on compensation of our named executive officers that were included in the plan for 2021,2023, which were:
| Name | Title | |||||||||
| Jonathan P. Stanner | President and Chief Executive Officer | |||||||||
| William H. Conkling | Executive Vice President and Chief Financial Officer | |||||||||
| Christopher R. Eng | Executive Vice President, General Counsel, Chief Risk Officer and Secretary | |||||||||
| Paul Ruiz | Senior Vice President and Chief Accounting Officer | |||||||||
Dividend Increase
In May 17, 2021.
In 2021,May 2023, the hospitality industry continued to be negatively affected byCompany completed the COVID-19 pandemic. The Company, led by the management team, continued to adaptdisposition of four hotels in Illinois and navigate throughMinnesota consisting of 467 guestrooms for a challenging operating environment to achieve significant accomplishments as highlighted below.gross sales price of $28.1 million.
In January 2022, after extensive negotiations, planning and preparation that began in July 2021,June 2023, the Company acquired hotels from affiliatescompleted the acquisition of NewcrestImage Holdings, LLCthe 47-room Nordic Lodge, Steamboat Springs, Colorado for $13.7 million and the 120-room Residence Inn, Scottsdale, Arizona for $29.0 million. Both acquisitions were completed through itsthe Company's joint venture with GIC, Singapore’sSingapore's sovereign wealth fund (“("Joint Venture”Venture"). The initial closing included 26 of 27 hotels totaling 3,533 guestrooms, two parking structures, and various financial incentives. The remaining hotel,
In December 2023, the newly constructed 176-guestroom Canopy by Hilton New Orleans, was acquired upon its opening in March 2022. The total consideration forCompany completed the transaction was comprised of $776.5 million, or $209,000 per key, for the 27-hotel portfolio, $24.8 million for the two parking structures, and $20.7 million for the various financial incentives. The transaction was structured to preserve nearly alldisposition of the Company’s existing liquidity and is expected123-room Hyatt Place, Baltimore/Owings Mills, Maryland for a gross sales price of $8.3 million.
In December 2023, the Company entered into a contract to be immediately accretive to earnings, leverage neutral to our balance sheet while preserving ample investment capacity. The Company funded its 51% equity contribution throughsell the issuance127-room Hyatt Place, Dallas/Plano for a gross sales price of common operating partnership units valued at $160 million and preferred operating partnership units with an annual coupon of 5.25% valued at $50$10.3 million. The Joint Venture secured a $410 million term loan and GIC’s equity contribution of $208 milliondisposition was fundedcompleted in cash.February 2024.
Capital Markets & Balance Sheet
Management enhanced the Company’s balance sheet throughout 20212023 and subsequent to year-end with the following significant transactions:following:
In March 2023, subsidiaries of the Joint Venture entered into two $100 million interest rate swaps to fix one-month term SOFR at 3.354% until January 2026. The interest rate swaps were effective in July 2023.
32
In June 2023, the Company completed the refinancing of its $600 million senior unsecured credit facility, which is comprised of a $400 million senior unsecured revolving credit facility and $200 million senior unsecured term loan. The $400 million revolving credit facility has a maturity date of June 2027, which may be extended by the Company for up to two consecutive six-month periods, subject to certain conditions and the $200 million term loan has a maturity date of June 2026, which may be extended by the Company for up to two consecutive 12-month periods, subject to certain conditions.
In September 2023, the Joint Venture completed the refinancing of its $200 million senior credit facility, which is comprised of a $125 million revolving credit facility and a $75 million term loan. The new credit agreement provides for an initial maturity date of September 2027, which may be extended for a single 12-month period at the Joint Venture's option, subject to certain conditions.
In January 2024, the Company closed onJoint Venture entered into a $287.5$100 million 1.50% Convertible Senior Notes offering due February 2026 withinterest rate swap to fix one-month term SOFR at 3.765% until January 2026. The interest rate swap has an initial conversion priceeffective date of $11.99 per share. Concurrent with the offering, the Company used $21.1 million of the offering proceeds to enter into capped call transactions with various counterparties that effectively increased the conversion price to $15.26 per share. Net proceeds from the offering were used to repay the Company’s then- outstanding senior revolving credit facility balance from $160.0 million to zero and partially repay the $225 million senior term loan maturing later this year.October 1, 2024.
In August,February 2024, the Company completed an offering of 4,000,000 shares of 5.875% Series F Cumulative Redeemable Preferred Stock for gross proceeds of $100 million. Net proceeds from the transaction were used to redeem all 3,000,000 shares of its 6.45% Series D Cumulative Redeemable Preferred Stock, while the remainder was used to partially repay the Company’s existinga new $200 million senior unsecured term loan maturing in 2022 by $22 million.
Full-Year 20212023 Financial Summary*
•Net Loss:Net loss attributable to common stockholders was $83.7$28.0 million or, $0.80$0.27 per diluted share, compared to a net loss of $158.2$16.9 million, or $1.52$0.16 per diluted share, in the same period of 2022. Adjusted for the year ended 2020.non-recurring (loss) gain on disposal of assets in 2023 and 2022, net loss attributable to common stockholders improved by $9.6 million in 2023 compared to the same period of 2022.
•
Pro Forma RevPAR: Pro forma revenue per available room (“RevPAR”) increased 54.76.6 percent from 20202022 to $81.13.$120.12. Pro forma average daily rate (“ADR”) increased 7.83.1 percent from 20202022 to $129.98,$166.27, and pro forma occupancy increased 43.53.4 percent to 62.472.2 percent.
•
Pro Forma Hotel EBITDA: Pro forma hotel EBITDA increased 6.0 percent to $109.4$260.5 million from $28.8$245.8 million in 2020. Pro forma hotel EBITDA margin expanded to 29.6 percent from 12.1 percent in 2020.2022.
•
Adjusted EBITDAre:Adjusted EBITDAre increased 5.1 percent to $90.5$190.0 million from $14.4$180.8 million for the year ended 2020.2022.
•
Adjusted FFO:Adjusted FFO was $36.8$112.9 million, or $0.35$0.92 per diluted share, compared to ($38.6)$114.0 million, or ($0.37)$0.94 per diluted share, for the year ended 2020.2022.
Company's Commitment to Diversity, Equity and Inclusion
We strive to cultivate a culture of connectedness for our employees based on our primary values of passion, integrity and excellence.excellence. We maintain various employee engagement and personal and professional development opportunities for our employees. We promote health, safety and well-being and continuously work to advance diversity, equity and inclusion. We value and embrace diversity and believe that unique perspectives allow for innovation and growth. We support pay equity and equal opportunities for all of our employees. We work to advance a supportive and inclusive work environment where all employees are empowered to succeed. In 2021,2023, all Company employees completed Diversity & Inclusion and Unconscious Bias training.
33
Company Workforce Highlights:Highlights as of March 31, 2024.
| Gender | 45% of Company employees are women. | |||||||
| Race & Ethnicity | 22% of Company employees are from racially/ethnically underrepresented groups. | |||||||
| Upward Mobility | Company promotions since March 1, 2023 were comprised of 56% women. | |||||||
Our executive compensation program consists of base salary, annual cash incentive compensation opportunities and annual long-term equity incentive grants. Our program is designed to be straightforward, transparent and market-based and to comply with sound corporate governance practices.
The chart below contains the key components of our executive compensation program, the purpose of each component and the process for determining each component.
| Compensation Component | Description and Objectives | |||||||||||||||||||||
| Base Salary | Fixed cash compensation set at a level reflective of each executive’s performance, market conditions, and competitive rates. | The Compensation Committee considered competitive salary information for the Company’s peer group when establishing | ||||||||||||||||||||
| Annual Cash Incentive Compensation | Performance-based cash incentive that rewards achievement of annual company-specific | |||||||||||||||||||||
Long-Term Equity Incentives | Equity incentives that align executive compensation with total stockholder return over multi-year performance and vesting periods that encourage the retention of key talent. | In Based on our 3-year TSR beginning on March | ||||||||||||||||||||
Compensation Best Practice Policies
We maintain several stockholder-friendly compensation policies, including stock ownership guidelines, a compensation clawback policy, and anti-hedging and anti-pledging policies (refer to “Corporate Governance Principles and Board Matters”Principles” for more detail on these policies). In addition, our employment agreements with executive officers have non-compete provisions, require a double trigger for any severance payouts in connection with a change-in-control and do not provide excise tax gross-up payments.
34
Results of Stockholder Say-on-Pay Votes
Each year, the Compensation Committee considers the outcome of the stockholder advisory (non-binding) vote onto approve executive compensation when making decisions relating to the compensation of our named executive officers and our executive compensation program design, structure and policies.
The rigorous “pay for performance” program the Company has implemented since our listing on the NYSE in 2011 has historically received strong stockholder support, for our executive compensation program with more than 98%both through voting outcomes on say-on-pay as well as direct feedback from investors, proxy advisory firms and other stakeholders. At the 2023 annual meeting of stockholders, approximately 96% of the votes cast were in favor of the “say-on-pay” proposal at our 2021 annual meeting of stockholders.advisory vote to approve the Company’s executive compensation. The Compensation Committee believes that thepast voting results together with the over 97% average approval received over the last three years, conveyedconvey our stockholders’ strong support of the philosophy, design and structure of our executive compensation program. The Compensation Committee will continue to consider the results of the stockholders’ say-on-pay votes when making decisions about our executive compensation program.
Objectives of Our Executive Compensation Program
Our executive compensation philosophy is designed to promote the following objectives:
•Assist in attracting and retaining talented and well-qualified executives by offering compensation opportunities competitive with other lodging REITs;
•
Motivate our executives to manage our business to meet our near-, medium- and long-term objectives and reward them for meeting these objectives;
•
Align the interests of our executives and stockholders by motivating executives to increase stockholder value and rewarding executives when stockholder value increases; and
•
Maintain high standards of corporate governance.
Role of the Compensation Committee and Management
The Compensation Committee is responsible for determining the amount and composition of compensation paid to our Chief Executive Officer and all other executive officers. The Compensation Committee exercises its independent judgment in reviewing and approving the executive compensation program as a whole, as well as specific compensation levels for each executive officer. Additionally, the Compensation Committee reviews and considers the recommendations of Mr. Stanner with respect to compensation decisions of our named executive officers other than himself.himself and other Company employees. The Compensation Committee believes it is valuable to consider the recommendations of Mr. Stanner with respect to these matters because, given his knowledge of our operations and the day-to-day responsibilities of our executive officers and other Company employees, he is in a unique position to provide the Compensation Committee perspective into the performance of our executive officers and other Company employees in light of our business at a given point in time.
Role of the Compensation Consultant
The Compensation Committee has retained FW Cook as its independent compensation consultant. The Compensation Committee has determined that FW Cook meets the criteria for an independent consultant in accordance with SEC guidelines for such service. FW Cook reports directly to the Compensation Committee and works with management only at the request and under the direction of the Compensation Committee. To assist the Compensation Committee in the development of our 20212023 executive compensation program, FW Cook conducted a comprehensive review of our executive compensation program in terms of the competitiveness of our target compensation opportunities and the appropriateness of our incentive programs in supporting our business strategy.
35
Peer Group Information
In general, the Compensation Committee uses comparative data from various companies as a guide in its review and determination of base salaries, annual cash bonusesincentive awards and annual equity awards.
For the compensation program review that informed decisions on target pay opportunities and program structure for 2021,2023, the Compensation Committee, with the help of FW Cook, established the peer group used to evaluate the competitiveness of our existing executive compensation program. A competitive compensation analysis was conducted in late 2022 to inform pay decisions for fiscal 2023. At that time, the Compensation Committee approved changes to the compensation peer group to remove Core Point Lodging, Inc. and New Senior Investment Group, Inc. as they are no longer publicly traded entities and added Elme Communities, Sabra Healthcare, Urban Edge and Whitestone REIT to the select peer group. The peer group for 2023 consisted of the following 10eight public REITs that primarily invest in hotels and foureight other public REITs outside of the hotel sector that were comparable in terms of market capitalization size and executive team members that the Compensation Committee and FW Cook considered to be the most relevant peers.
| Apple Hospitality REIT, Inc. | |||||||||||
| CareTrust REIT, Inc. | |||||||||||
| Chatham Lodging Trust | |||||||||||
| Community Healthcare Trust Inc. | |||||||||||
| DiamondRock Hospitality | Sunstone Hotel Investors, Inc. | ||||||||||
| Urban Edge | |||||||||||
| Hersha Hospitality Trust | Whitestone REIT | ||||||||||
| LTC Properties, Inc. | Xenia Hotels & Resorts | ||||||||||
Elements of 20212023 Executive Compensation
2023 Target Total Direct Compensation (“TDC”)
Target TDC for 20212023 consisted of salary, target annual cash incentives and target long-term equity incentives. The Compensation Committee considered the mix of the three components of TDC and significantly weighted the long-term equity incentive component the highest to align compensation with long-term stockholder value. We believe that the 2023 Target TDC for each executive, which is set forth in the table below, generally approximates the market median, and the mix between compensation elements is generally consistent with the mix used by companies in our peer group.
| Name | Salary ($) | Annual Cash Incentive ($)(1) | Long-Term Incentives ($)(2) | Target TDC ($) | ||||||||||||||||||||||
| Jonathan P. Stanner | 700,000 | 1,050,000 | 3,300,000 | 5,050,000 | ||||||||||||||||||||||
| William H. Conkling | 470,000 | 470,000 | 1,200,000 | 2,140,000 | ||||||||||||||||||||||
| Christopher R. Eng | 400,000 | 400,000 | 500,000 | 1,300,000 | ||||||||||||||||||||||
| Paul Ruiz | 315,000 | 267,750 | 480,000 | 1,062,750 | ||||||||||||||||||||||
| Name | | | Salary ($) | | | Annual Cash Incentive ($)(1) | | | Long-Term Incentives ($)(2) | | | Target TDC ($) | | ||||||||||||
| Daniel P. Hansen | | | | | 500,000 | | | | | | — | | | | | | 1,500,000 | | | | | | 2,000,000 | | |
| Jonathan P. Stanner | | | | | 600,000 | | | | | | 900,000 | | | | | | 2,500,000 | | | | | | 4,000,000 | | |
William H. Conkling(3) | | | | | 450,000 | | | | | | 450,000 | | | | | | 1,100,000(4) | | | | | | 2,000,000 | | |
| Craig J. Aniszewski | | | | | 450,000 | | | | | | 450,000 | | | | | | 1,100,000 | | | | | | 2,000,000 | | |
| Christopher R. Eng | | | | | 375,000 | | | | | | 375,000 | | | | | | 450,000 | | | | | | 1,200,000 | | |
| Paul Ruiz | | | | | 300,000 | | | | | | 210,000 | | | | | | 400,000 | | | | | | 910,000 | | |
(1)
Reflects the “target” level payout of our annual cash incentive award program. Given Mr. Hansen’s transition to the role of Executive Chairman in January 2021, the Compensation Committee did not include an annual cash incentive award as part of his TDC as Mr. Hansen did not participate in the Company’s day-to-day operations.
(2)
Reflects the “target” level value of long-term incentive awards consisting 60% of performance share awards and 40% of time-based awards, other than for Mr. Hansen whose award was made 100% in time-based awards as Mr. Hansen did not participate in the Company’s day-to-day operations.awards. The Compensation Committee determines the intended target dollar value. The number of shares issued to each executive is determined by dividing the intended target dollar value of the award by the average of the trailing 10-day VWAP of our common stock prior to the date of grant. The grant-date fair value of long-term incentive awards as disclosed in the Summary Compensation Table and Grants of Plan-Based Awards Table may be different.are different because they represent the grant date fair value of the awards in accordance with ASC 718.
36
Base Salary
Base salaries are designed to provide a fixed level of compensation that serves as a retention tool. Base salaries are reviewed annually by the Compensation Committee and are subject to annual adjustments at the discretion of the Compensation Committee. For executives who remained in the same position in 2021 as they held in 2020, salaries were not adjusted. Mr. Hansen’s base salary was reduced in connection with his transition from Chairman, President and Chief Executive Officer to Executive Chairman, effective January 15, 2021. Mr. Stanner’s base salary was increased in connection with his promotion from Executive Vice President and Chief Financial Officer to President and Chief Executive Officer, effective January 15, 2021. The Compensation Committee determined these salary adjustments based on market conditions and competitive compensation information for similar positions at other companies. Base salaries for 20212022 and 2023 for our named executive officers were as follows:
| Name | | 2021 ($) | | 2020 ($) | | Percentage Increase/(Decrease) | | Name | 2023 ($) | 2022 ($) | Percentage Increase/(Decrease) | |||||||||||||||||||||||||||||||||||||||
| Daniel P. Hansen | | | | 500,000 | | | | | 700,000 | | | | | (29)% | | | ||||||||||||||||||||||||||||||||||
| Jonathan P. Stanner | | | | 600,000 | | | | | 450,000 | | | | | 33% | | | Jonathan P. Stanner | 700,000 | 700,000 | 700,000 | — | — | % | |||||||||||||||||||||||||||
| William H. Conkling | | | | 450,000 | | | | | — | | | N/A | | William H. Conkling | 470,000 | 470,000 | 470,000 | — | — | % | ||||||||||||||||||||||||||||||
| Craig J. Aniszewski | | | | 450,000 | | | | | 450,000 | | | | | —% | | | ||||||||||||||||||||||||||||||||||
| Christopher R. Eng | | | | 375,000 | | | | | 375,000 | | | | | —% | | | Christopher R. Eng | 400,000 | 375,000 | 375,000 | 6.67 | 6.67 | % | |||||||||||||||||||||||||||
| Paul Ruiz | | | | 300,000 | | | | | 300,000 | | | | | —% | | | Paul Ruiz | 315,000 | 315,000 | 315,000 | — | — | % | |||||||||||||||||||||||||||
Annual Cash Incentive Program
Our 20212023 annual cash incentive program was designed to provide the named executive officers an opportunity to earn compensation based on the achievement of challenging company-specific performance goals and the executive’s achievement of individual performance goals set against the continuing pandemic.goals.
In 2021,2023, the Compensation Committee revised the design ofupdated our annual cash incentive program to incorporate performance measures that strongly support our business strategies, with a particular focus on the challenges to our business from the ongoing pandemic.strategies. The performance measures and weightings established by our Compensation Committee for 20212023 under our annual cash compensationincentive program are set forth below.
| Corporate Performance Measure | Total Weight | ||||||||||||
| Balance Sheet Objective | |||||||||||||
| Transactions Objective | |||||||||||||
| Total | |||||||||||||
2023 Same Store Hotel EBITDA*
The Operating ObjectiveSame Store Hotel EBITDA component of the 20212023 annual incentive program was Same Store Hotel EBITDA, measured on a consolidated basis and adjusted for any sold hotels during 2021.2023. Hotel EBITDA contribution from hotels acquired during 20212023 were excluded. Same Store Hotel EBITDA goals at the Threshold, Target and Maximum levels were:
•Threshold:
$231.7 million
$231.7 million
Actual 20212023 Same Store Hotel EBITDA was $106$256.6 million, resulting in payout between the Threshold and Target level for this measure.
*Same Store Hotel EBITDA was calculated based on the financial results for 98 hotels owned as of December 31, 2023 and excluded the financial results of hotels acquired or disposed in 2023.
37
2023 Balance Sheet Objective
The Board evaluated management's performance against five identified balance sheet initiatives for 2023, including refinancing significant debt facilities, maintaining a prudent fixed rate debt plus preferred percentage, managing leverage levels below a certain net debt to EBITDA* maximum and maintaining a minimum liquidity threshold.
*EBITDA is net income (loss) plus interest, taxes, depreciation and amortization.
Threshold, Target and Maximum performance were based on achieving two, three and four out of the five initiatives, respectively. Management achieved four out of the five initiatives resulting in payout at the Maximum level for this measure.component.
The Transactions Objective was intended to reward the team’s sourcing and execution of high-quality acquisitions and dispositions governed by the Company’s risk adjusted return driven investment discipline. The Threshold, Target and Maximum goals for this measure were:
component were•
Threshold:
•
Target:
•
Maximum:
Actual acquisition and disposition volume in 2021 (including2023 was $95.9 million, resulting in payout between Threshold and Target level for this measure.
2023 Capital Expenditure Objective
The Board evaluated Management's performance against four identified capital expenditure initiatives, including the acquisitions announced in 2021 thatcommencement and completion of a specified number of projects as well as managing projects substantially closed withinon-time and on-budget.
Threshold, Target and Maximum performance were based on achieving two, three and four out of the firstfour initiatives, respectively. Management achieved two weeksout of 2022) exceeded $1 billion,the four initiatives resulting in payout at the MaximumThreshold level for this measure.component.
2023 Strategic Plan Objectives
For 2023, the Board did not set separate performance goals for individual executive officers. Instead, the Board established objectives based on metrics associated with the Company's strategic plan that included review of overall company strategy, ongoing review of capital allocation alternatives, in-depth capital markets review and outlook, continued progress on developing and evolving the Company's Corporate Responsibility Plan and performing a detailed review of the Company's succession plan for key corporate positions.
The ESG Objective was establishedamounts payable to advanceeach executive officer with respect to the Company’s ESG program withStrategic Plan Objectives were determined within the following areasBoard's discretion after an evaluation of focus:
38
The total annual cash incentive opportunity ranges for 2021,2023, and the actual total cash incentive compensation earned and paid for 20212023 performance as a percentage of base salary, were as follows:
| | | 2021 Annual Cash Incentive Opportunity (% of Base Salary) | | 2021 Annual Cash Incentive Earned | | 2021 Annual Cash Incentive Earned | | |||||||||||||||||||||||||||||||||||||||||||||||||||||||||||||||||||||||||||||||||
| 2023 Annual Cash Incentive Opportunity (% of Base Salary) | 2023 Annual Cash Incentive Opportunity (% of Base Salary) | 2023 Annual Cash Incentive Earned | ||||||||||||||||||||||||||||||||||||||||||||||||||||||||||||||||||||||||||||||||||||||
| Name | | Threshold | | Target | | Maximum | | % of Target | | $ | | Name | Threshold | Target | Maximum | % of Target | $ | |||||||||||||||||||||||||||||||||||||||||||||||||||||||||||||||||||||||
| Jonathan P. Stanner | | | | 75% | | | | | 150% | | | | | 300% | | | | | 140% | | | | | 1,260,000 | | | Jonathan P. Stanner | 75.0% | 150% | 300% | 98% | 1,033,711 | ||||||||||||||||||||||||||||||||||||||||||||||||||||||||
| William H. Conkling | | | | 50% | | | | | 100% | | | | | 200% | | | | | 146% | | | | | 657,000 | | | William H. Conkling | 50.0% | 100% | 200% | 98% | 462,709 | ||||||||||||||||||||||||||||||||||||||||||||||||||||||||
| Craig J. Aniszewski | | | | 50% | | | | | 100% | | | | | 200% | | | | | 142% | | | | | 639,000 | | | ||||||||||||||||||||||||||||||||||||||||||||||||||||||||||||||
| Christopher R. Eng | | | | 50% | | | | | 100% | | | | | 200% | | | | | 140% | | | | | 525,000 | | | Christopher R. Eng | 50.0% | 100% | 200% | 98% | 393,795 | ||||||||||||||||||||||||||||||||||||||||||||||||||||||||
| Paul Ruiz | | | | 35% | | | | | 70% | | | | | 140% | | | | | 146% | | | | | 306,600 | | | Paul Ruiz | 42.5% | 85% | 170% | 98% | 263,597 | ||||||||||||||||||||||||||||||||||||||||||||||||||||||||
The following table sets forth the payouts under the Operating Objective,Same Store Hotel EBITDA component, the Balance Sheet component, the Transaction Objective component, the Transactions Objective, the ESG ObjectiveCapital Expenditure component and the Individual Performance ObjectiveStrategic Plan component that each named executive officer earned in 2021:2023:
| Name | | | Operating Objective Payout ($) | | | Balance Sheet Objective Payout ($) | | | Transactions Objective Payout ($) | | | ESG Objective Payout ($) | | | Individual Performance Objective Payout ($) | | | Total 2021 Annual Cash Incentive Payout ($) | | ||||||||||||||||||
| Jonathan P. Stanner | | | | | 450,000 | | | | | | 225,000 | | | | | | 270,000 | | | | | | 135,000 | | | | | | 180,000 | | | | | | 1,260,000 | | |
| William H. Conkling | | | | | 225,000 | | | | | | 112,500 | | | | | | 135,000 | | | | | | 67,500 | | | | | | 117,000 | | | | | | 657,000 | | |
| Craig J. Aniszewski | | | | | 225,000 | | | | | | 112,500 | | | | | | 135,000 | | | | | | 67,500 | | | | | | 99,000 | | | | | | 639,000 | | |
| Christopher R. Eng | | | | | 187,500 | | | | | | 93,750 | | | | | | 112,500 | | | | | | 56,250 | | | | | | 75,000 | | | | | | 525,000 | | |
| Paul Ruiz | | | | | 105,000 | | | | | | 52,500 | | | | | | 63,000 | | | | | | 31,500 | | | | | | 54,600 | | | | | | 306,600 | | |
| Name | Same Store EBITDA Payout ($) | Balance Sheet Payout ($) | Transaction Objective Payout ($) | Capital Expenditure Payout ($) | Strategic Plan Payout ($) | Total 2023 Annual Cash Incentive Payout ($) | ||||||||||||||||||||||||||||||||
| Jonathan P. Stanner | $ | 460,568 | $ | 210,000 | $ | 100,643 | $ | 52,500 | $ | 210,000 | $ | 1,033,711 | ||||||||||||||||||||||||||
| William H. Conkling | 206,159 | 94,000 | 45,050 | 23,500 | 94,000 | 462,709 | ||||||||||||||||||||||||||||||||
| Christopher R. Eng | 175,455 | 80,000 | 38,340 | 20,000 | 80,000 | 393,795 | ||||||||||||||||||||||||||||||||
| Paul Ruiz | 117,445 | 53,550 | 25,664 | 13,388 | 53,550 | 263,597 | ||||||||||||||||||||||||||||||||
Long-Term Incentive Compensation
Long-term equity incentives granted in 20212023 consisted of a combination of performance-based and time-based stock awards. The Compensation Committee determined a target total long-term incentive grant value for each named executive officer. Mr. Hansen’s 2021 long-term incentive grant value was substantially lower than his 2020 grant value and awarded 100% in time-based restricted shares of common stock to reflect his new role as Executive Chairman. Mr. Stanner’s long-term incentive grant value was higher than his 2020 grant value to reflect his promotion to President and Chief Executive Officer. For Messrs. Stanner, Conkling, Aniszewski, Eng and Ruiz,all named executive officers, the ongoingtypical annual long-term incentive awards were granted 60% in the form of performance-based stock (at target) and 40% in the form of time-based stock. In addition, Mr. Conkling received a one-time, sign-on award of $750,000 in restricted shares of common stock that will vest over a three-year period, which was intended to replace compensation forfeited from his prior employer.
| Name | Performance-Based Stock Target Value ($) | Time-Based Stock Value ($) | Total LTI Grant Value at Target ($) | |||||||||||||||||
| Jonathan P. Stanner | 1,980,000 | 1,320,000 | 3,300,000 | |||||||||||||||||
| William H. Conkling | 720,000 | 480,000 | 1,200,000 | |||||||||||||||||
| Christopher R. Eng | 300,000 | 200,000 | 500,000 | |||||||||||||||||
| Paul Ruiz | 288,000 | 192,000 | 480,000 | |||||||||||||||||
| Name | | | Performance-Based Stock Target Value ($) | | | Time-Based Stock Value ($) | | | Total LTI Grant Value at Target ($) | | |||||||||
Daniel P. Hansen(1) | | | | | — | | | | | | 1,500,000 | | | | | | 1,500,000 | | |
| Jonathan P. Stanner | | | | | 1,500,000 | | | | | | 1,000,000 | | | | | | 2,500,000 | | |
William H. Conkling(2) | | | | | 660,000 | | | | | | 1,190,000 | | | | | | 1,850,000 | | |
| Craig J. Aniszewski | | | | | 660,000 | | | | | | 440,000 | | | | | | 1,100,000 | | |
| Christopher R. Eng | | | | | 270,000 | | | | | | 180,000 | | | | | | 450,000 | | |
| Paul Ruiz | | | | | 240,000 | | | | | | 160,000 | | | | | | 400,000 | | |
The Compensation Committee granted these stock awards under the Equity Incentive2011 Plan. The number of shares granted was based on the VWAP of our common stock for the ten10 trading days preceding the grant date. Note that theThe grant-date fair values, as reported in the Summary Compensation Table and the Grants of Plan-Based Awards table, differ from the values shown in the table above because the grant-date fair value of each performance-based award under ASC 718 is based on a Monte Carlo value and the grant-date fair value of each time-based award is based on the closing share price on the grant date.
39
Performance-Based Stock Awards
The performance-based stock awards are tied to the Company’s TSR relative to the TSR of companies in the SNLDow Jones U.S. Lodging REITHotel Index with a market capitalization of at least $100 million as of the grant date (“Index Companies”). The number of shares that may be earned can range from 00% to 200% of the target shares granted, based on our relative TSR percentile rank over the three-year performance period starting March 8, 2021,2023, and ending March 8, 20242026 (“Performance Period”), according to the table below.
| Company 3-Year TSR Percentile Rank vs. Index Companies | Percent of Target Shares Earned | ||||||||||||
< 30th Percentile | |||||||||||||
30th Percentile | |||||||||||||
55th Percentile | |||||||||||||
≥ 80th Percentile | |||||||||||||
The number of shares earned will be linearly interpolated for performance between the 30th and 55th percentile and for performance between the 55th and 80th percentile. In addition, if the Company’s absolute TSR is equal to or greater than 8.5% per year (or 25.5% cumulative over the Performance Period), at least 25% of the performance-based shares will be earned.
The Company entered into stock award agreements with the above-named executive officers, effective as of March 8, 2021,2023, setting forth the terms and conditions of the performance-based stock awards. Except as described below, no performance-based shares will vest unless the executive remains in the continuous employ of the Company from the date of grant until March 8, 2024.2026. On and after the date of the grant and prior to forfeiture of any of the performance-based shares, the executives will have the right to vote the shares that have been issued (i.e., the target number). Cash dividends on the performance-based shares will be accumulated and will only be paid to the executives to the extent the underlying performance-based share is earned.
If a “change in control” (as(as defined in the Company’s Equity Incentive2011 Plan), occurs prior to the conclusion of the Performance Period, the performance-based shares will be earned based on the Company’s
relative or absolute TSR performance as described above up to the date of the change in control, and any earned shares will be fully vested on the third anniversary of the grant date (the end of the original performance period), subject to acceleration if either (a) the successor entity does not assume or replace the award, or (b) the participant is terminated without cause or is voluntarily terminated for good reason. Under these circumstances, the executives will be entitled to receive any dividend equivalent payments to which they are entitled under the terms of the stock award agreements.
If an executive’s employment is terminated on account of death or disability, termination without cause or voluntary termination for good reason, the performance-based shares may be earned contingent upon the attainment of the relative or absolute TSR performance hurdles at the end of the Performance Period. However, the number of performance-based shares earned by the executive, and the amount of any dividend equivalent payments to which the executive is entitled pursuant to the terms of the stock award agreement, will be adjusted pro rata based on the amount of time the executive was employed by the Company during the Performance Period.
For purposes of the performance-based stock awards, the Company’s TSR will be calculated as the total percentage return per share of the Company’s common stock calculated in accordance with the methods used by SNL Financial to calculate TSR. The TSR for the Index Companies will be calculated in the same manner.
Performance-Based Stock Awards Vesting
Based on our 3-year TSR beginning on March 7, 20198, 2021 and ending March 7, 2022, certain previously granted8, 2024, all performance-based restricted stock awards granted to executives on March 8, 2021 were earned at 137%forfeited as a result of target.performance metrics not being met. See Footnote (4) under “Outstanding Equity Awards at Fiscal Year-End”.
40
Time-Based Stock Awards
The Company entered into stock award agreements with the executive officers setting forth the terms and conditions of the time-based stock awards. The stock award agreements provide for vesting over a three-year period as follows: 25% of shares will vest on March 9, 2022;2024; 25% of the shares will vest on March 9, 2023;2025; and 50% of the shares will vest on March 9, 2024.2026.
Except as described below, no time-based shares will vest unless the executive remains in the continuous employ of the Company from the date of grant until the applicable vesting date. If a “change in control” (as(as defined in the Equity Incentive2011 Plan) occurs prior to vesting and if the successor entity does not assume or replace the time-based shares, all unvested time-based shares will vest on a “control change date”,date,” as defined in the Equity Incentive2011 Plan if the executive remains in the continuous employ of the Company from the date of grant until the control change date. In addition, all of the time-based shares (if not sooner vested), will vest on the date that the executive’s employment with the Company ends on account of the executive’s death or “disability”, or if the executive’s employment is terminated without “cause”,“cause,” or if the executive resigns for “good reason” (each(each as defined in the employment agreement between the Company and the executive).
Any time-based shares that have not vested as described above may not be transferred and will be forfeited on the date the executive’s employment with the Company terminates. On and after the date of grant and prior to forfeiture of any time-based shares, the executive will have the right to vote the time-based shares and to receive, free of all restrictions, all dividends declared and paid on the Company’s common stock, whether or not vested.
Other Benefits; 401(k) Plan
We provide benefits such as medical, dental and life insurance and disability coverage for all of our employees, including our named executive officers. We also provide personal paid time off and other paid holidays to all employees, including the named executive officers. We believe that our employee benefit plans are an appropriate element of compensation and are necessary to attract and retain employees.
We maintain a retirement savings plan under section 401(k) of the Internal Revenue Code to cover our eligible employees. We currently match 100% of each eligible participant’s contributions, within prescribed
limits, up to 3% of such participant’s base salary and 50% of each eligible participant’s contributions up to an additional 2% of the participant’s base salary.
Employment Agreements
To specify our expectations with regard to our executive officers’ duties and responsibilities, and to provide greater certainty with regard to the amounts payable to our executive officers in connection with certain terminations or change in control events, the Board approved, and we entered into employment agreements with each of our executive officers. We believe that the terms of the employment agreements provide these executives with day-to-day employment stability and enable them to properly focus their attention on their duties and responsibilities with the company, thereby promoting productivity. For information concerning the employment agreements and the named executive officers' right to severance payments and/or benefits upon termination of employment see "Employment Agreements" and "Potential Payments Upon Termination or Change in Control" in section titled "Executive Compensation" in this proxy statement.
Tax Deductibility of Executive Compensation
The Compensation Committee considers the anticipated tax treatment to the Company and the executive officers in its review and establishment of compensation programs and payments. The deductibility of some types of incentive compensation payments can depend upon the timing of the executive’s vesting or exercise of previously granted rights. Interpretations of and changes in applicable tax laws and regulations, as well as other factors beyond the committee’s control, also can affect deductibility of compensation. The Compensation Committee’s general policy is to maintain flexibility in compensating executive officers in a manner designed to promote varying corporate goals. Accordingly, the Compensation Committee has not adopted a policy that all compensation must be deductible.
41
Accounting Standards
ASC 718 requires us to recognize an expense for the fair value of equity-based compensation awards. Grants of equity awards under our Equity Incentive2011 Plan will be accounted for under ASC 718. The Compensation Committee will regularly consider the accounting implications of significant compensation decisions, especially in connection with decisions that relate to our equity plans and programs. As accounting standards change, we may revise certain programs to appropriately align accounting expenses of our equity awards with our overall executive compensation philosophy and objectives.
COMPENSATION COMMITTEE REPORT
The Compensation Committee of the Board of Summit Hotel Properties, Inc. has reviewed and discussed the Compensation Discussion and Analysis appearing in this proxy statement with management of the Company. Based on the Compensation Committee’s review of the CD&A and the Compensation Committee’s discussions of the CD&A with management, the Compensation Committee recommended to the Board (and the Board has approved) that the CD&A be included in the Company’s proxy statement on Schedule 14A prepared in connection with the annual meeting.
Compensation Committee of the Board:
Kenneth J. Kay (Chair)
Amina Belouizdad
Jeffrey W. Jones
Amina Belouizdad Porter
Thomas W. Storey
April 3, 2024
42
EXECUTIVE COMPENSATION
Summary Compensation Table
The table below summarizes the total compensation paid or earned by each of our named executive officers for the three fiscal yearyears ended December 31, 2023, 2022 and 2021.
| Name and Principal Position | | | Year | | | Base Salary ($) | | | Stock Awards ($)(1) | | | Non-Equity Incentive Plan Compensation ($)(2) | | | All Other Compensation ($)(3) | | | Total ($) | | ||||||||||||||||||
| Daniel P. Hansen | | | | | 2021 | | | | | | 510,769 | | | | | | 3,055,440 | | | | | | — | | | | | | 11,600 | | | | | | 3,577,809 | | |
| Executive Chairman (prior President & CEO)* | | | | | 2020 | | | | | | 673,078 | | | | | | 2,707,920 | | | | | | 798,000 | | | | | | 11,400 | | | | | | 4,190,398 | | |
| | | | | | 2019 | | | | | | 700,000 | | | | | | 2,946,123 | | | | | | 1,352,400 | | | | | | 11,200 | | | | | | 5,009,723 | | |
| Jonathan P. Stanner | | | | | 2021 | | | | | | 591,923 | | | | | | 3,068,586 | | | | | | 1,260,000 | | | | | | 11,600 | | | | | | 4,932,109 | | |
President & CEO (prior EVP & CFO)* | | | | | 2020 | | | | | | 432,692 | | | | | | 1,063,816 | | | | | | 351,000 | | | | | | 11,400 | | | | | | 1,858,908 | | |
| | | | | | 2019 | | | | | | 450,000 | | | | | | 1,157,404 | | | | | | 597,600 | | | | | | 11,200 | | | | | | 2,216,204 | | |
| William H. Conkling | | | | | 2021 | | | | | | 276,923 | | | | | | 2,076,275 | | | | | | 657,000 | | | | | | 57 | | | | | | 3,010,255 | | |
| EVP, CFO** | | | | | 2020 | | | | | | — | | | | | | — | | | | | | — | | | | | | — | | | | | | — | | |
| | | | | | 2019 | | | | | | — | | | | | | — | | | | | | — | | | | | | — | | | | | | — | | |
| Craig J. Aniszewski | | | | | 2021 | | | | | | 450,000 | | | | | | 1,350,175 | | | | | | 639,000 | | | | | | 11,600 | | | | | | 2,450,775 | | |
| EVP, COO | | | | | 2020 | | | | | | 432,692 | | | | | | 1,063,816 | | | | | | 324,000 | | | | | | 11,400 | | | | | | 1,831,908 | | |
| | | | | | 2019 | | | | | | 450,000 | | | | | | 1,157,404 | | | | | | 570,600 | | | | | | 11,200 | | | | | | 2,189,204 | | |
| Christopher R. Eng | | | | | 2021 | | | | | | 375,000 | | | | | | 552,339 | | | | | | 525,000 | | | | | | 11,600 | | | | | | 1,463,939 | | |
| EVP, CRO, GC | | | | | 2020 | | | | | | 360,578 | | | | | | 435,198 | | | | | | 277,500 | | | | | | 11,400 | | | | | | 1,084,676 | | |
| | | | | | 2019 | | | | | | 375,000 | | | | | | 473,487 | | | | | | 490,500 | | | | | | 11,200 | | | | | | 1,350,187 | | |
| Paul Ruiz | | | | | 2021 | | | | | | 300,000 | | | | | | 490,980 | | | | | | 306,600 | | | | | | 11,600 | | | | | | 1,109,180 | | |
| SVP, CAO | | | | | 2020 | | | | | | 288,461 | | | | | | 386,840 | | | | | | 155,400 | | | | | | 11,400 | | | | | | 842,101 | | |
| | | | | | 2019 | | | | | | 300,000 | | | | | | 420,873 | | | | | | 266,280 | | | | | | 11,200 | | | | | | 998,353 | | |
| Name and Principal Position | Year | Base Salary ($) | Stock Awards ($)(1) | Non-Equity Incentive Plan Compensation ($)(2) | All Other Compensation ($)(3) | Total ($) | ||||||||||||||||||||||||||||||||
| Jonathan P. Stanner | 2023 | 700,000 | 3,905,300 | 1,033,711 | 13,200 | 5,652,211 | ||||||||||||||||||||||||||||||||
| President & CEO | 2022 | 700,000 | 3,458,856 | 1,254,000 | 12,200 | 5,425,056 | ||||||||||||||||||||||||||||||||
| 2021 | 591,923 | 3,068,586 | 1,260,000 | 11,600 | 4,932,109 | |||||||||||||||||||||||||||||||||
| William H. Conkling | 2023 | 470,000 | 1,420,100 | 462,709 | 13,200 | 2,366,009 | ||||||||||||||||||||||||||||||||
| EVP & CFO | 2022 | 470,000 | 1,268,315 | 570,000 | 12,200 | 2,320,515 | ||||||||||||||||||||||||||||||||
| 2021 | 276,923 | 2,076,275 | * | 657,000 | — | 3,010,198 | ||||||||||||||||||||||||||||||||
| Christopher R. Eng | 2023 | 400,000 | 591,700 | 393,795 | 13,200 | 1,398,695 | ||||||||||||||||||||||||||||||||
| EVP, CRO, GC | 2022 | 375,000 | 518,825 | 450,000 | 12,200 | 1,356,025 | ||||||||||||||||||||||||||||||||
| 2021 | 375,000 | 552,339 | 525,000 | 11,600 | 1,463,939 | |||||||||||||||||||||||||||||||||
| Paul Ruiz | 2023 | 315,000 | 568,000 | 263,597 | 13,200 | 1,159,797 | ||||||||||||||||||||||||||||||||
| SVP, CAO | 2022 | 315,000 | 518,825 | 252,000 | 12,200 | 1,098,025 | ||||||||||||||||||||||||||||||||
| 2021 | 300,000 | 490,980 | 306,600 | 11,600 | 1,109,180 | |||||||||||||||||||||||||||||||||
**
Mr. Conkling was appointed Executive Vice President and Chief Financial Officer effective May 17, 2021 and received a one-time sign-on award of $750,000 of restricted shares vesting over a three-year period.
(1)
Amounts in this column represent the aggregate grant date fair value based on the probable outcome of the performance conditions to which such shares are subject, computed in accordance with ASC 718, of time-based and performance-based stock awards granted under our Equity Incentive2011 Plan.The grant date fair value of performance-based stock was determined using a Monte Carlo simulation. The assumptions used in calculating these amounts are discussed in Note 2 (“Basis of Presentation and Significant Accounting Policies —– Equity-Based Compensation”) and Note 1213 (“Equity-Based Compensation”) to our audited consolidated financial statements included in our Annual Report. The amount for Mr. Hansen includes $2.9 million of additional stock-based compensation expense related to the modification of certain stock awards upon his separation from his role as Executive Chairman.
(2)
Amounts in this column represent aggregate cash payouts pursuant to the Annual Cash Incentive Program as described in “Compensation Discussion and Analysis —– Compensation Elements —– Annual Cash Incentive Program.”
(3)
The amounts in the “All Other Compensation” column for Messrs. Hansen, Stanner, Conkling, Aniszewski, Eng and Ruiz reflect contributions made by us to each of our named executive officers’ 401(k) accounts.
43
Grants of Plan-Based Awards
The table below sets forth information with respect to plan-based awards granted in 20212023 to our named executive officers:
Estimated Future Payouts Under Non-2011 Plan Awards | Estimated Future Payouts Under 2011 Plan Awards | All Other Stock Awards: Number of Shares of Stock (#) | All Other Option Awards: Number of Securities Underlying Options (#) | Exercise or Base Price of Option Awards ($/Share) | Grant Date Fair Value of Awards ($)(4) | |||||||||||||||||||||||||||||||||||||||||||||||||||||||||||||||
| Name | Grant Date | Threshold ($) | Target ($) | Maximum ($) | Threshold (#) | Target (#) | Maximum (#) | |||||||||||||||||||||||||||||||||||||||||||||||||||||||||||||
| Jonathan P. | 3/8/2023 | (1) | 525,000 | 1,050,000 | 2,100,000 | — | — | — | — | — | — | — | ||||||||||||||||||||||||||||||||||||||||||||||||||||||||
| Stanner | 3/8/2023 | (2) | — | — | — | 64,119 | 256,477 | 512,954 | — | — | — | 2,585,300 | ||||||||||||||||||||||||||||||||||||||||||||||||||||||||
| 3/8/2023 | (3) | — | — | — | — | — | — | 170,984 | — | — | 1,320,000 | |||||||||||||||||||||||||||||||||||||||||||||||||||||||||
| William H. | 3/8/2023 | (1) | 235,000 | 470,000 | 940,000 | — | — | — | — | — | — | — | ||||||||||||||||||||||||||||||||||||||||||||||||||||||||
| Conkling | 3/8/2023 | (2) | — | — | — | 23,316 | 93,264 | 186,528 | — | — | — | 940,100 | ||||||||||||||||||||||||||||||||||||||||||||||||||||||||
| 3/8/2023 | (3) | — | — | — | — | — | — | 62,176 | — | — | 480,000 | |||||||||||||||||||||||||||||||||||||||||||||||||||||||||
| Christopher | 3/8/2023 | (1) | 200,000 | 400,000 | 800,000 | — | — | — | — | — | — | — | ||||||||||||||||||||||||||||||||||||||||||||||||||||||||
| R. Eng | 3/8/2023 | (2) | — | — | — | 9,715 | 38,860 | 77,720 | — | — | — | 391,700 | ||||||||||||||||||||||||||||||||||||||||||||||||||||||||
| 3/8/2023 | (3) | — | — | — | — | — | — | 25,907 | — | — | 200,000 | |||||||||||||||||||||||||||||||||||||||||||||||||||||||||
| Paul Ruiz | 3/8/2023 | (1) | 133,875 | 267,750 | 535,500 | — | — | — | — | — | — | — | ||||||||||||||||||||||||||||||||||||||||||||||||||||||||
| 3/8/2023 | (2) | — | — | — | 9,327 | 37,306 | 74,612 | — | — | — | 376,000 | |||||||||||||||||||||||||||||||||||||||||||||||||||||||||
| 3/8/2023 | (3) | — | — | — | — | — | — | 24,870 | — | — | 192,000 | |||||||||||||||||||||||||||||||||||||||||||||||||||||||||
| Name | | | Grant Date | | | Estimated Future Payouts Under Non-Equity Incentive Plan Awards | | | Estimated Future Payouts Under Equity Incentive Plan Awards | | | All Other Stock Awards: Number of Shares of Stock (#) | | | All Other Option Awards: Number of Securities Underlying Options (#) | | | Exercise or Base Price of Option Awards ($/Share) | | | | | | | | | Grant Date Fair Value of Awards ($)(4) | | |||||||||||||||||||||||||||||||||||||||||||||
| | Threshold ($) | | | Target ($) | | | Maximum ($) | | | Threshold (#) | | | Target (#) | | | Maximum (#) | | ||||||||||||||||||||||||||||||||||||||||||||||||||||||||
| Daniel P. Hansen | | | | | 3/8/21(3) | | | | | | — | | | | | | — | | | | | | — | | | | | | — | | | | | | — | | | | | | — | | | | | | 145,914 | | | | | | — | | | | | | — | | | | | | | | | | | | 1,527,720 | | |
| | | | 3/7/19(5) | | | | | | — | | | | | | — | | | | | | — | | | | | | — | | | | | | — | | | | | | — | | | | | | 144,703 | | | | | | — | | | | | | — | | | | | | | | | | | | 2,137,408 | | | ||
| | | | 3/7/19(5) | | | | | | — | | | | | | — | | | | | | — | | | | | | — | | | | | | — | | | | | | — | | | | | | 96,469 | | | | | | — | | | | | | — | | | | | | | | | | | | 470,774 | | | ||
| | | | 3/7/20(5) | | | | | | — | | | | | | — | | | | | | — | | | | | | — | | | | | | — | | | | | | — | | | | | | 180,258 | | | | | | — | | | | | | — | | | | | | | | | | | | 2,080,898 | | | ||
| | | | 3/7/20(5) | | | | | | — | | | | | | — | | | | | | — | | | | | | — | | | | | | — | | | | | | — | | | | | | 120,172 | | | | | | — | | | | | | — | | | | | | | | | | | | 879,659 | | | ||
| | | | 3/8/21(5) | | | | | | — | | | | | | — | | | | | | — | | | | | | — | | | | | | — | | | | | | — | | | | | | 145,914 | | | | | | — | | | | | | — | | | | | | | | | | | | 1,068,086 | | | ||
| Jonathan P. Stanner | | | | | 3/8/21(1) | | | | | | 450,000 | | | | | | 900,000 | | | | | | 1,800,000 | | | | | | — | | | | | | — | | | | | | — | | | | | | — | | | | | | — | | | | | | — | | | | | | | | | | | | — | | |
| | | | 3/8/21(2) | | | | | | — | | | | | | — | | | | | | — | | | | | | 36,479 | | | | | | 145,915 | | | | | | 291,830 | | | | | | — | | | | | | — | | | | | | — | | | | | | | | | | | | 2,050,106 | | | ||
| | | | 3/8/21(3) | | | | | | — | | | | | | — | | | | | | — | | | | | | — | | | | | | — | | | | | | — | | | | | | 97,276 | | | | | | — | | | | | | — | | | | | | | | | | | | 1,018,480 | | | ||
| William H. Conkling | | | | | 5/17/21(1) | | | | | | 225,000 | | | | | | 450,000 | | | | | | 900,000 | | | | | | — | | | | | | — | | | | | | — | | | | | | — | | | | | | — | | | | | | — | | | | | | — | | | | | | — | | |
| | | | 5/17/21(2) | | | | | | — | | | | | | — | | | | | | — | | | | | | 16,051 | | | | | | 64,202 | | | | | | 128,404 | | | | | | — | | | | | | — | | | | | | — | | | | | | — | | | | | | 902,038 | | | ||
| | | | 5/17/21(3) | | | | | | — | | | | | | — | | | | | | — | | | | | | — | | | | | | — | | | | | | — | | | | | | 119,333 | | | | | | — | | | | | | — | | | | | | — | | | | | | 1,174,237 | | | ||
| Craig J. Aniszewski | | | | | 3/8/21(1) | | | | | | 225,000 | | | | | | 450,000 | | | | | | 900,000 | | | | | | — | | | | | | — | | | | | | — | | | | | | — | | | | | | — | | | | | | — | | | | | | | | | | | | — | | |
| | | | 3/8/21(2) | | | | | | — | | | | | | — | | | | | | — | | | | | | 16,051 | | | | | | 64,202 | | | | | | 128,404 | | | | | | — | | | | | | — | | | | | | — | | | | | | | | | | | | 902,038 | | | ||
| | | | 3/8/21(3) | | | | | | — | | | | | | — | | | | | | — | | | | | | — | | | | | | — | | | | | | — | | | | | | 42,802 | | | | | | — | | | | | | — | | | | | | | | | | | | 448,137 | | | ||
| Christopher R. Eng | | | | | 3/8/21(1) | | | | | | 187,500 | | | | | | 375,000 | | | | | | 750,000 | | | | | | — | | | | | | — | | | | | | — | | | | | | — | | | | | | — | | | | | | — | | | | | | | | | | | | — | | |
| | | | 3/8/21(2) | | | | | | — | | | | | | — | | | | | | — | | | | | | 6,566 | | | | | | 26,264 | | | | | | 52,528 | | | | | | — | | | | | | — | | | | | | — | | | | | | | | | | | | 369,009 | | | ||
| | | | 3/8/21(3) | | | | | | — | | | | | | — | | | | | | — | | | | | | — | | | | | | — | | | | | | — | | | | | | 17,510 | | | | | | — | | | | | | — | | | | | | | | | | | | 183,330 | | | ||
| Paul Ruiz | | | | | 3/8/21(1) | | | | | | 105,000 | | | | | | 210,000 | | | | | | 420,000 | | | | | | — | | | | | | — | | | | | | — | | | | | | — | | | | | | — | | | | | | — | | | | | | | | | | | | — | | |
| | | | 3/8/21(2) | | | | | | — | | | | | | — | | | | | | — | | | | | | 5,837 | | | | | | 23,347 | | | | | | 46,694 | | | | | | — | | | | | | — | | | | | | — | | | | | | | | | | | | 328,025 | | | ||
| | | | 3/8/21(3) | | | | | | — | | | | | | — | | | | | | — | | | | | | — | | | | | | — | | | | | | — | | | | | | 15,564 | | | | | | — | | | | | | — | | | | | | | | | | | | 162,955 | | | ||
(1)
Represents the threshold, target and maximum potential payouts for the annual cash incentive awards granted in 20212023 to each named executive officer under our Equity Incentive2011 Plan. For each executive, the incentive award earned was paid out in cash in March 2022, except as otherwise detailed below.2024. For more information, see “Compensation Discussion and Analysis — Compensation Elements — Elements—Annual Cash Incentive Program.”
(2)
Represents performance-based restricted stock awards granted to our named executive officers under our Equity Incentive2011 Plan, which vest following the end of the performance period on March 8, 2024,2026, based on the Company’s absolute and relative TSR achievement.achievement, subject to continued service through the end of the performance period except in the case of certain terminations of employment or in the case of a change in control, as discussed in more detail in “Compensation Discussion and Analysis – Compensation Elements – Performance-Based Stock Awards.”
(3)
Represents time-based restricted stock awards granted to our named executive officers under our Equity Incentive2011 Plan. The time-based restricted stock awards vest annually on a 25%, 25%, 50% schedule over a three-year period.period, subject to continued service through the applicable vesting date except in the case of certain terminations of employment or in the case of a change in control, as discussed in more detail in “Compensation Discussion and Analysis – Compensation Elements – Time-Based Stock Awards.”
(4)
Represents the aggregate grant date fair value of the performance-based stock awards and the time-based stock awards granted to our named executive officers under our Equity Incentive2011 Plan. The amounts have been computed in accordance with ASC 718. The grant date fair value of performance-based awards was determined using a Monte Carlo simulation. For more information regarding our assumptions
made in the valuation of these stock awards, see Note 2 and Note 1213 to our audited consolidated financial statements included in our Annual Report.
Discussion of Summary Compensation and Grants of Plan-Based Awards Tables
Our executive compensation policies and practices, pursuant to which the compensation set forth in the Summary Compensation Table and the Grants of Plan-Based Awards table was paid or awarded to our named executive officers, are described above under “Compensation Discussion and Analysis.”
44
Outstanding Equity Awards at Fiscal Year-End
The table below sets forth information with respect to outstanding equity awards held by the named executive officers as of December 31, 2021.
| Name | | | Number of Shares or Units of Stock That Have Not Vested (#)(2) | | | Market Value of Shares or Units of Stock That Have Not Vested ($)(1) | | | Equity Incentive Plan Awards: Number of Unearned Shares, Units or Other Rights That Have Not Vested (#)(3) | | | Equity Incentive Plan Awards: Market or Payout Value of Unearned Shares, Units or Other Rights That Have Not Vested ($)(1) | | ||||||||||||
Daniel P. Hansen | | | | | — | | | | | | — | | | | | | 378,708 | | | | | | 3,696,190 | | |
Jonathan P. Stanner | | | | | 151,631 | | | | | | 1,479,919 | | | | | | 440,608 | | | | | | 4,300,334 | | |
William H. Conkling | | | | | 119,333 | | | | | | 1,164,690 | | | | | | 128,404 | | | | | | 1,253,223 | | |
Craig J. Aniszewski | | | | | 97,157 | | | | | | 948,252 | | | | | | 277,182 | | | | | | 2,705,296 | | |
Christopher R. Eng | | | | | 39,747 | | | | | | 387,931 | | | | | | 113,392 | | | | | | 1,106,706 | | |
| Paul Ruiz | | | | | 35,330 | | | | | | 344,821 | | | | | | 100,795 | | | | | | 983,759 | | |
| Name | Grant Date | Number of Shares or Units of Stock That Have Not Vested (#)(2) | Market Value of Shares or Units of Stock That Have Not Vested ($)(1) | 2011 Plan Awards: Number of Unearned Shares, Units or Other Rights That Have Not Vested (#)(3) | 2011 Plan Awards: Market or Payout Value of Unearned Shares, Units or Other Rights That Have Not Vested ($)(1) | |||||||||||||||||||||||||||
| Jonathan P. | 3/8/2021 | 48,638 | 326,847 | 36,479 | 245,139 | |||||||||||||||||||||||||||
| Stanner | 3/8/2022 | 91,931 | 617,776 | 45,965 | 308,886 | |||||||||||||||||||||||||||
| 3/8/2023 | 170,984 | 1,149,012 | 64,119 | 430,881 | ||||||||||||||||||||||||||||
| William H. | 5/17/2021 | 59,665 | 400,949 | 16,051 | 107,859 | |||||||||||||||||||||||||||
| Conkling | 3/8/2022 | 33,708 | 226,518 | 16,854 | 113,259 | |||||||||||||||||||||||||||
| 3/8/2023 | 62,176 | 417,823 | 23,316 | 156,684 | ||||||||||||||||||||||||||||
| Christopher | 3/8/2021 | 8,754 | 58,827 | 6,566 | 44,124 | |||||||||||||||||||||||||||
| R. Eng | 3/8/2022 | 13,790 | 92,669 | 6,895 | 46,333 | |||||||||||||||||||||||||||
| 3/8/2023 | 25,907 | 174,095 | 9,715 | 65,285 | ||||||||||||||||||||||||||||
| Paul Ruiz | 3/8/2021 | 7,782 | 52,295 | 5,837 | 39,223 | |||||||||||||||||||||||||||
| 3/8/2022 | 13,790 | 92,669 | 6,895 | 46,333 | ||||||||||||||||||||||||||||
| 3/8/2023 | 24,870 | 167,126 | 9,327 | 62,674 | ||||||||||||||||||||||||||||
(2)
Time-Based Shares. Vesting dates for unvested time-based shares listed in the above table are as follows:
| Vesting Date | | | Hansen | | | Stanner | | | Conkling | | | Aniszewski | | | Eng | | | Ruiz | | ||||||||||||||||||
| March 9, 2022 | | | | | — | | | | | | 55,070 | | | | | | 10,701 | | | | | | 41,452 | | | | | | 16,958 | | | | | | 15,074 | | |
| May 17, 2022 | | | | | — | | | | | | — | | | | | | 19,133 | | | | | | — | | | | | | — | | | | | | — | | |
| March 9, 2023 | | | | | — | | | | | | 47,923 | | | | | | 10,701 | | | | | | 34,305 | | | | | | 14,035 | | | | | | 12,474 | | |
| May 17, 2023 | | | | | — | | | | | | — | | | | | | 19,133 | | | | | | — | | | | | | — | | | | | | — | | |
| March 9, 2024 | | | | | — | | | | | | 48,638 | | | | | | 21,400 | | | | | | 21,400 | | | | | | 8,754 | | | | | | 7,782 | | |
| May 17, 2024 | | | | | — | | | | | | — | | | | | | 38,265 | | | | | | — | | | | | | — | | | | | | — | | |
| Vesting Date | Stanner | Conkling | Eng | Ruiz | ||||||||||||||||||||||
| March 9, 2024 | 122,027 | 48,180 | 19,827 | 18,596 | ||||||||||||||||||||||
| May 17, 2024 | — | 38,265 | — | — | ||||||||||||||||||||||
| March 9, 2025 | 104,034 | 38,016 | 15,671 | 15,411 | ||||||||||||||||||||||
| March 9, 2026 | 85,492 | 31,088 | 12,953 | 12,435 | ||||||||||||||||||||||
(3)
Performance-Based Shares. Potential vesting dates for unvested performance-based shares listed in the above table are as follows:
| Vesting Date | | | Hansen | | | Stanner | | | Conkling | | | Aniszewski | | | Eng | | | Ruiz | | ||||||||||||||||||
March 7, 2022(4) | | | | | 198,450 | | | | | | 77,963 | | | | | | — | | | | | | 77,963 | | | | | | 31,894 | | | | | | 28,350 | | |
March 7, 2023(5) | | | | | 180,258 | | | | | | 70,815 | | | | | | — | | | | | | 70,815 | | | | | | 28,970 | | | | | | 25,751 | | |
March 8, 2024(6) | | | | | — | | | | | | 291,830 | | | | | | 128,404 | | | | | | 128,404 | | | | | | 52,528 | | | | | | 46,694 | | |
| Vesting Date | Stanner | Conkling | Eng | Ruiz | ||||||||||||||||||||||
March 8, 2024(4) | 36,479 | 16,051 | 6,566 | 5,837 | ||||||||||||||||||||||
March 8, 2025(5) | 45,965 | 16,854 | 6,895 | 6,895 | ||||||||||||||||||||||
March 8, 2026(6) | 64,119 | 23,316 | 9,715 | 9,327 | ||||||||||||||||||||||
(4)
(5) In accordance with SEC rules, amounts shown are based on maximumthreshold level of achievement of the relative TSR performance goal. As of December 31, 2023, the TSR performance goal was below threshold level of achievement.
45
Option Exercises and Stock Vested
The following tables set forth information regarding option award exercising and stock vesting during 2021.
| | | | Option Awards | | | Stock Awards | | ||||||||||||||||||
| Name | | | Number of Shares Acquired on Exercise (#) | | | Value Realized on Exercise ($) | | | Number of Shares Acquired on Vesting (#) | | | Value Realized on Vesting ($)(1) | | ||||||||||||
| Daniel P. Hansen | | | | | — | | | | | | — | | | | | | 469,019 | | | | | | 4,674,949 | | |
| Jonathan P. Stanner | | | | | — | | | | | | — | | | | | | 64,804 | | | | | | 666,895 | | |
| William H. Conkling | | | | | — | | | | | | — | | | | | | — | | | | | | — | | |
| Craig J. Aniszewski | | | | | — | | | | | | — | | | | | | 74,477 | | | | | | 766,065 | | |
| Christopher R. Eng | | | | | — | | | | | | — | | | | | | 30,469 | | | | | | 313,402 | | |
| Paul Ruiz | | | | | — | | | | | | — | | | | | | 22,246 | | | | | | 228,983 | | |
| Stock Awards | ||||||||||||||
| Name | Number of Shares Acquired on Vesting (#) | Value Realized on Vesting ($)(1) | ||||||||||||
| Jonathan P. Stanner | 123,584 | 946,415 | ||||||||||||
| William H. Conkling | 41,070 | 300,223 | ||||||||||||
| Christopher R. Eng | 37,048 | 282,880 | ||||||||||||
| Paul Ruiz | 33,440 | 255,374 | ||||||||||||
(1) Amounts represent the number of shares that vested multiplied by the per share closing price of our common stock on the applicable vesting date.
Equity Compensation Plan Information
The following table provides information about our Common Stock that may be issued under our 2011 Plan as of December 31, 2023.
| Plan Category | (i) Number of Securities to be Issued Upon Exercise of Outstanding Options, Warrants and Rights | (ii) Weighted Average Exercise Price of Outstanding Options, Warrants and Rights ($) | (iii) Number of Securities Remaining Available for Future Issuance Under Equity Compensation Plans (Excluding Securities Reflected in Column (i)) | |||||||||||||||||
Equity Compensation Plans Approved by Security Holders (1) | — | — | 2,002,788 | |||||||||||||||||
| Equity Compensation Plans Not Approved by Security Holders | — | — | — | |||||||||||||||||
| Total | — | — | 2,002,788 | |||||||||||||||||
(1) The 2011 Plan was last amended and restated in 2021 and approved by shareholders on May 13, 2021. The 2011 Plan authorizes the grant of awards for the issuance of 3,956,347 shares plus the issuance of shares of Common Stock under awards granted prior to May 13, 2021 pursuant to the terms of the equity plan in effect at the time of grant.
Employment Agreements and Executive Officer Separations
To specify our expectations with regard to our executive officers’ duties and responsibilities, and to provide greater certainty with regard to the amounts payable to our executive officers in connection with certain terminations or change in control events, the Board approved, and we entered into employment agreements with each of our executive officers. We believe that the terms of the employment agreements provide these executives with day-to-day employment stability and enable them to properly focus their attention on their duties and responsibilities with the company, thereby promoting productivity.
We entered into employment agreements with each of our executive officers: effective as of May 28, 2014, with Mr. Aniszewski and Mr. Eng. We entered into an employment agreement,Eng, effective as of January 1, 2015, with Mr. Ruiz, effective as of January 15, 2021, with Mr. Stanner and we entered into an employment agreement, effective as of May 17, 2021, with Mr. Conkling. In connectionThe agreements with the transition of Mr. Hansen to Executive Chairman and Mr. Stanner to President and Chief Executive Officer, we entered into new employment agreements, effective January 15, 2021 with Mr. Hansen and Mr. Stanner. Mr. Hansen’s agreement terminated on January 1, 2022.
Potential Payments Upon Termination or Change in Control
The table below reflects the amount of compensation that our named executive officers would be entitled to receive under their employment agreements. The amounts shown assume that such termination
was effective as of December 31, 20212023 and are only estimates of the amounts that would be paid out to such executives upon termination of their employment. The actual amounts to be paid out can only be determined at the time of such executive’s separation from the company.Company. In the event of a termination by the companyCompany for cause, or by the executive without good reason, including in connection with a change in control, such executive would not be entitled to any of the amounts reflected in the table and would only be entitled to the standard termination benefits provided under their employment agreement.
| | | | Termination Without Cause or Voluntary Termination for Good Reason (No Change in Control) ($) | | | Termination Without Cause or Voluntary Termination for Good Reason (Change in Control) ($) | | | Death or Disability(1) ($) | | |||||||||
| Daniel P. Hansen | | | | | | | | | | | | | | | | | | | |
Cash Severance Payment(2) | | | | | 1,000,000 | | | | | | — | | | | | | — | | |
Medical/Welfare Benefits(3) | | | | | 23,280 | | | | | | — | | | | | | — | | |
Acceleration of Equity Awards(4) | | | | | 3,171,619 | | | | | | — | | | | | | 3,171,619 | | |
| Total(5) | | | | | 4,194,899 | | | | | | | | | | | | 3,171,619 | | |
| Jonathan P. Stanner | | | | | | | | | | | | | | | | | | | |
Cash Severance Payment(2) | | | | | 3,351,000 | | | | | | 4,851,000 | | | | | | — | | |
Medical/Welfare Benefits(3) | | | | | 20,000 | | | | | | 20,000 | | | | | | — | | |
Acceleration of Equity Awards(4) | | | | | 4,150,040 | | | | | | 4,150,040 | | | | | | 4,150,040 | | |
Total(5) | | | | | 7,521,040 | | | | | | 9,021,040 | | | | | | 4,150,040 | | |
| William H. Conkling | | | | | | | | | | | | | | | | | | | |
Cash Severance Payment(2) | | | | | 1,350,000 | | | | | | 1,800,000 | | | | | | | | |
Medical/Welfare Benefits(3) | | | | | 18,000 | | | | | | 18,000 | | | | | | | | |
Acceleration of Equity Awards(4) | | | | | 1,791,302 | | | | | | 1,791,302 | | | | | | 1,791,302 | | |
| Total(5) | | | | | 3,159,302 | | | | | | 3,615,302 | | | | | | 1,791,302 | | |
| Craig J. Aniszewski | | | | | | | | | | | | | | | | | | | |
Cash Severance Payment(2) | | | | | 1,674,000 | | | | | | 2,124,000 | | | | | | — | | |
Medical/Welfare Benefits(3) | | | | | 16,956 | | | | | | 16,956 | | | | | | — | | |
Acceleration of Equity Awards(4) | | | | | 2,820,854 | | | | | | 2,820,854 | | | | | | 2,820,854 | | |
| Total(5) | | | | | 4,511,810 | | | | | | 4,961,810 | | | | | | 2,820,854 | | |
| Christopher R. Eng | | | | | | | | | | | | | | | | | | | |
Cash Severance Payment(2) | | | | | 1,402,500 | | | | | | 1,777,500 | | | | | | — | | |
Medical/Welfare Benefits(3) | | | | | 22,000 | | | | | | 22,000 | | | | | | — | | |
Acceleration of Equity Awards(4) | | | | | 1,153,993 | | | | | | 1,153,993 | | | | | | 1,153,993 | | |
Total(5) | | | | | 2,578,493 | | | | | | 2,953,493 | | | | | | 1,153,993 | | |
| Paul Ruiz | | | | | | | | | | | | | | | | | | | |
Cash Severance Payment(2) | | | | | 920,400 | | | | | | 1,175,400 | | | | | | — | | |
Medical/Welfare Benefits(3) | | | | | 20,000 | | | | | | 20,000 | | | | | | — | | |
Acceleration of Equity Awards(4) | | | | | 1,025,776 | | | | | | 1,025,776 | | | | | | 1,025,776 | | |
Total(5) | | | | | 1,966,176 | | | | | | 2,221,176 | | | | | | 1,025,776 | | |
Termination Without Cause or Voluntary Termination for Good Reason (No Change in Control) ($) | Termination Without Cause or Voluntary Termination for Good Reason (Change in Control) ($) | Death or Disability(1) ($) | ||||||||||||||||||
| Jonathan P. Stanner | ||||||||||||||||||||
Cash Severance Payment(2) | 4,754,000 | 6,504,000 | — | |||||||||||||||||
Medical/Welfare Benefits(3) | 19,834 | 19,834 | — | |||||||||||||||||
Acceleration of Equity Awards(4) | 3,078,540 | 3,078,540 | 3,078,540 | |||||||||||||||||
Total(5) | 7,852,374 | 9,602,374 | 3,078,540 | |||||||||||||||||
| William H. Conkling | ||||||||||||||||||||
Cash Severance Payment(2) | 1,980,000 | 2,450,000 | — | |||||||||||||||||
Medical/Welfare Benefits(3) | 7,732 | 7,732 | — | |||||||||||||||||
Acceleration of Equity Awards(4) | 1,423,094 | 1,423,094 | 1,423,094 | |||||||||||||||||
Total(5) | 3,410,826 | 3,880,826 | 1,423,094 | |||||||||||||||||
| Christopher R. Eng | ||||||||||||||||||||
Cash Severance Payment(2) | 1,650,000 | 2,050,000 | — | |||||||||||||||||
Medical/Welfare Benefits(3) | 19,834 | 19,834 | — | |||||||||||||||||
Acceleration of Equity Awards(4) | 481,333 | 481,333 | 481,333 | |||||||||||||||||
Total(5) | 2,151,167 | 2,551,167 | 481,333 | |||||||||||||||||
| Paul Ruiz | ||||||||||||||||||||
Cash Severance Payment(2) | 1,126,125 | 1,417,500 | — | |||||||||||||||||
Medical/Welfare Benefits(3) | 20,429 | 20,429 | — | |||||||||||||||||
Acceleration of Equity Awards(4) | 460,327 | 460,327 | 460,327 | |||||||||||||||||
Total(5) | 1,606,881 | 1,898,256 | 460,327 | |||||||||||||||||
(1)A termination of the executive officer’s employment due to death or disability entitles the executive officer to benefits under our life insurance and disability insurance plans. In addition, outstanding stock awards that have not yet vested, immediately vest upon the executive officer’s termination of employment due to death or disability. The unvested stock award figurefigures in the table reflects 324,961,
(2)Pursuant to the terms of each executive officer’sofficer's employment agreement, if the executive’sexecutive's employment with the Company is terminated by the Company without cause or by the executive for good reason, the severance payment isexecutive will receive the sum of the following: (A)(1) earned but unpaid base salary, (2) accrued byand unpaid vacation pay through the date of termination, and (3) any vested amounts due under any plan, program or policy of the Company, to the extent not previously paid (if any) (together, the “Accrued Obligations”"Accrued Obligations"); and (B) a severance amount equal to: (i) one and one-half (two for Mr. Stanner) times the executive’s base salary in effect on the date of termination ($600,000, $450,000, $375,000700,000, $470,000, $400,000 and $300,000$315,000 for Messrs. Stanner, Conkling, Eng and Ruiz, respectively), plus (ii) one and one-half (two for Mr. Stanner) times the executive’sexecutive's target annual cash bonus for the year of termination ($900,000,1,050,000, $470,000, $400,000 and $267,750 for Messrs. Stanner, Conkling, Eng and Ruiz, respectively), plus
47
(iii) a pro rata portion of the annual cash bonus for the partial fiscal year in which the date of termination occurs equal to the product of the annual cash bonus earned by the executive for the fiscal year of the Company ended immediately before the date of termination ($1,254,000, $570,000, $450,000 $375,000 and $210,000$252,000 for Messrs. Stanner, Conkling, Eng and Ruiz, respectively) and a fraction, the numerator of which is the number of days the executive was employed by the Company during the fiscal year that includes the date of termination and the denominator of which is 365. The calculations contemplate a December 31, 2023 termination date. The cash severance payment amounts in the table do not include any Accrued Obligations.
Pursuant to the terms of each executive officer's employment agreement, if the executive's employment with the Company is terminated by the Company without cause or by the executive for good reason with a change of control, the severance payment is the sum of the following: (A)(1) earned but unpaid base salary, (2) accrued and unpaid vacation pay through the date of termination, and (3) any vested amounts due under any plan, program or policy of the Company, to the extent not previously paid (if any) (together, the "Accrued Obligations"); and (B) a severance amount equal to: (i) two (three for Mr. Stanner) times the executive's base salary in effect on the date of termination ($700,000, $470,000, $400,000 and $315,000 for Messrs. Stanner, Conkling, Eng and Ruiz, respectively), plus (ii) two (three for Mr. Stanner) times the executive's target annual cash bonus for the year of termination ($1,050,000, $470,000, $400,000 and $267,750 for Messrs. Stanner, Conkling, Eng and Ruiz, respectively), plus (iii) a pro rata portion of the annual cash bonus for the partial fiscal year in which the date of termination occurs equal to the product of the annual cash bonus earned by the executive for the fiscal year of the Company ended immediately before the date of termination ($351,000, $277,5001,254,000, $570,000, $450,000 and $155,400$252,000 for Messrs. Stanner, Eng and Ruiz, respectively) and a fraction, the numerator of which is the number of days the executive was employed by the Company during the fiscal year that includes the date of termination and the denominator of which is 365. Pursuant to Mr. Hansen’s employment agreement, if his employment with the Company is terminated by the Company without cause or by the executive for good reason, the severance payment is $1,000,000. The calculations contemplate a December 31, 2021 termination date. The cash severance payment amounts in the table do not include any Accrued Obligations.
(3)The amounts shown in this row are estimates of cash payments for twelve months of COBRA premiums for the executive and eligible dependents to be paid by us pursuant to each executive officer’sofficer's employment agreement.
(4)
Assumes outstanding stock awards that have not yet vested will immediately vest in the event the executive’sexecutive's employment with the Company is terminated by the Company without cause or by the executive for good reason. The unvested stock award figure in the table reflects 425,209, 289,022, 118,237,the value of 458,116, 211,770, 71,627, and 105,10068,501 restricted shares for Messrs. Stanner, Conkling, Eng and Ruiz, respectively, based on the closing common stock price of $9.76$6.72 on the NYSE as of December 31, 2021.2023.
(5)
The employment agreements with our named executive officers do not provide an indemnification or gross-up payment for the parachute payment excise tax under Sections 280G and 4999 of the Code. The employment agreements instead provide that the severance and any other payments or benefits that are treated as parachute payments under the Code will be reduced to the maximum amount that can be paid without an excise tax liability. The parachute payments will not be reduced, however, if the executive will receive greater after-tax benefits by receiving the total or unreduced benefits (after
considering any excise tax liability payable by the executive). The amounts shown in the table assume that the executive officer will receive the total or unreduced benefits.
CEO Pay Ratio Summary
Pursuant to the Dodd-Frank Wall Street Reform and Consumer Protection Act, the SEC requires calculation of total compensation paid to the median paid employee, as well as the ratio of the total compensation paid to the CEO as compared to the median paid employee.
We identified the median employee by examining the sum of annual base salary, target annual bonus, and the grant-date fair value of equity awards granted during 20212023 for all employees other than our CEO (Mr. Stanner) who were employed by us on December 31, 2021.2023. We did not make any adjustments or estimates.
After identifying the median paid employee, we then calculated total compensation for such employee using the same methodology we use for our named executive officers as set forth in the 20212023 Summary Compensation Table in this proxy statement. The total compensation of our median paid employee for 20212023 was $119,761.$130,970. The annual total compensation for our CEO for 20212023 was $4,332,555.$5,652,211. As a result, our 20212023 CEO to median employee pay ratio is, therefore, approximately 36:43:1.
48
This information involves reasonable estimates based on employee payroll records and other relevant company information. In addition, SEC rules for identifying the median employee and determining the CEO pay ratio permit companies to employ a wide range of methodologies, estimates and assumptions. As a result, the CEO pay ratios reported by other companies, which may have employed other permitted methodologies or assumptions and which may have a significantly different work force structure from ours, are likely not comparable to our CEO pay ratio.
Pay Versus Performance Table
Provided below is the Company’s “pay versus performance” disclosure as required pursuant to Item 402(v) of Regulation S-K promulgated under the Exchange Act. As required by Item 402(v), we have included:
A list of the most important measures that our Compensation Committee used in 2023 to link a measure of pay calculated in accordance with Item 402(v) (referred to as “compensation actually paid,” or “CAP”) to Company performance;
A table that compares the total compensation of our principal executive officer (“PEO”) and the average compensation of our non-PEO named executive officers ("NEOs") as presented in the Summary Compensation Table (“SCT”) to the applicable CAP and that compares CAP to specified performance measures; and
Graphs that describe:
•The relationships between PEO CAP, average non-PEO NEO CAP, our cumulative total shareholder return
(“TSR”) and the TSR of the Dow Jones U.S. Hotel Index (“Peer Group TSR”); and
•The relationships between PEO CAP, average non-PEO NEO CAP and GAAP Net Income/(Loss).
•The relationship between PEO CAP, average non-PEO NEO CAP and our Company selected
measure, Same Store Hotel EBITDA.
This disclosure has been prepared in accordance with Item 402(v) and does not necessarily reflect value actually realized by the executives or how our Compensation Committee evaluates compensation decisions in light of Company or individual performance. In particular, our Compensation Committee has not used CAP as a basis for making compensation decisions, nor does it use GAAP Net Income for purposes of determining incentive compensation. Please refer to our Compensation Discussion and Analysis on pages 32 to 42 for a discussion of our executive compensation program objectives and the ways in which we align executive compensation pay with performance.
The following table sets forth information concerning the compensation of our NEOs for each of the fiscal years ended December 31, 2020, 2021, 2022 and 2023, and our financial performance for each such fiscal year:
| (a) | (b) | (bb) | (c) | (cc) | (d) | (e) | (f) | (g) | (h) | (i) | ||||||||||||||||||||||||||||||||||||||||||||||||||||
| Year | Summary Compensation Table Total for PEO (Daniel Hansen) ($) | Summary Compensation Table Total for PEO (Jonathan Stanner) ($) | Compensation Actually Paid to PEO (Daniel Hansen) ($)(1)(2) | Compensation Actually Paid to PEO (Jonathan Stanner) ($)(1)(2) | Average Summary Compensation Table Total for Non-PEO NEOs ($)(1) | Average Compensation Actually Paid to Non-PEO NEOs ($)(1)(2) | Value of Initial Fixed $100 Investment Based on: Total Shareholder Return ($) | Value of Initial Fixed $100 Investment Based on: Peer Group Total Shareholder Return ($)(3) | Net Income (Loss) ($)(in thousands) | Company Selected Measure (Same Store Hotel EBITDA) (in thousands)(4) | ||||||||||||||||||||||||||||||||||||||||||||||||||||
| 2023 | N/A | 5,652,211 | N/A | 2,346,004 | 1,641,500 | 1,064,557 | $ | 57.75 | $ | 81.91 | $ | (28,116) | $ | 246,743 | ||||||||||||||||||||||||||||||||||||||||||||||||
| 2022 | N/A | 5,425,056 | N/A | 2,237,567 | 1,218,111 | 497,242 | $ | 59.98 | $ | 71.42 | $ | 1,217 | $ | 179,563 | ||||||||||||||||||||||||||||||||||||||||||||||||
| 2021 | 3,577,809 | 4,932,109 | 2,957,229 | 3,659,557 | 2,011,423 | 1,309,123 | $ | 80.32 | $ | 84.40 | $ | (68,584) | $ | 106,027 | ||||||||||||||||||||||||||||||||||||||||||||||||
| 2020 | 4,190,398 | N/A | 2,959,388 | N/A | 939,671 | 842,826 | $ | 74.15 | $ | 73.69 | $ | (149,245) | $ | 27,792 | ||||||||||||||||||||||||||||||||||||||||||||||||
(1) Amounts represent compensation actually paid to our PEO and the average compensation actually paid to our remaining NEOs for the relevant fiscal year, as determined under SEC rules (and described below), which includes the individuals indicated in the table below for each fiscal year:
49
| Year | PEO | Non-PEO NEOs | ||||||||||||
| 2023 | Jonathan Stanner | William Conkling, Christopher Eng and Paul Ruiz | ||||||||||||
| 2022 | Jonathan Stanner | Craig Aniszewski, William Conkling, Christopher Eng and Paul Ruiz | ||||||||||||
| 2021 | Jonathan Stanner and Daniel Hansen* | Craig Aniszewski, William Conkling, Christopher Eng and Paul Ruiz | ||||||||||||
| 2020 | Daniel Hansen | Craig Aniszewski, Christopher Eng, Paul Ruiz and Jonathan Stanner | ||||||||||||
*Mr. Hansen served as PEO from January 1 to January 14, 2021. Mr. Stanner became PEO on January 15, 2021.
(2) Fair value or change in fair value, as applicable, of equity awards in the "Compensation Actually Paid" columns was determined by reference to (i) for solely service-vesting time-based awards, the closing price per share on the applicable year-end date(s) or, in the case of vesting dates, the closing price per share on the applicable vesting date(s); and (ii) for performance-based stock awards, for market-based awards, the fair value calculated by a Monte Carlo simulation model as of the applicable year-end date(s), which utilizes multiple input variables, including expected dividend yield, expected volatility of our stock price, risk-free interest rate and other assumptions appropriate for determining fair value, to estimate the probability of satisfying the performance objective established for the award. For additional information on the assumptions used to calculate the valuation of the awards, see the Notes to Consolidated Financial Statements in our Annual Report on Form 10-K for the fiscal year ended December 31, 2023 and prior fiscal years.
(3) For the relevant fiscal year, represents the cumulative TSR (the “Peer Group TSR”) of the Dow Jones U.S. Hotels Index (the “Peer Group”).
(4) Same Store Hotel EBITDA is a non-GAAP financial measure and includes operating and financial results for assets owned as of any fiscal year-end, and at all times during the previous fiscal year. EBITDA is net income (loss) plus interest, taxes, depreciation and amortization. There may be same-store portfolio classification exceptions resulting from significant transaction activity that results in assets being owned for nearly the entire preceding fiscal year.
Compensation actually paid to our NEOs represents the “Total” compensation reported in the Summary Compensation Table for the applicable fiscal year, as adjusted as follows:
50
| 2020 | 2021 | 2022 | 2023 | |||||||||||||||||||||||||||||||||||||||||||||||
| Adjustments | PEO Daniel Hansen) | Average Non-PEO NEOs | PEO (Jonathan Stanner) | Average Non-PEO NEOs | PEO (Jonathan Stanner) | Average Non-PEO NEOs | PEO (Jonathan Stanner) | Average Non-PEO NEOs | ||||||||||||||||||||||||||||||||||||||||||
| Deduction for Amounts Reported under the “Stock Awards” and “Option Awards” Columns in the Summary Compensation Table for Applicable FY | $ | (2,708,677) | $ | (590,099) | $ | (3,068,585) | $ | (1,117,442) | $ | (3,458,856) | $ | (768,635) | $ | (3,905,300) | $ | (859,933) | ||||||||||||||||||||||||||||||||||
| Increase based on ASC 718 Fair Value of Awards Granted during Applicable FY that Remain Unvested as of Applicable FY End, determined as of Applicable FY End | 2,202,113 | 599,678 | 1,796,033 | 547,786 | 1,243,530 | 276,340 | 2,325,504 | 512,080 | ||||||||||||||||||||||||||||||||||||||||||
| Increase/deduction for Awards Granted during Prior FY that were Outstanding and Unvested as of Applicable FY End, determined based on change in ASC 718 Fair Value from Prior FY End to Applicable FY End | (659,498) | (90,187) | — | (95,227) | (972,163) | (269,544) | (1,835,941) | (278,176) | ||||||||||||||||||||||||||||||||||||||||||
| Increase/deduction for Awards Granted during Prior FY that Vested During Applicable FY, determined based on change in ASC 718 Fair Value from Prior FY End to Vesting Date | (64,948) | (16,237) | — | (37,417) | — | 40,969 | 39,283 | 29,428 | ||||||||||||||||||||||||||||||||||||||||||
| Increase based on Dividends or Other Earnings Paid during Applicable FY prior to Vesting Date | — | — | — | — | — | — | 70,247 | 19,657 | ||||||||||||||||||||||||||||||||||||||||||
| TOTAL ADJUSTMENTS | $ | (1,231,010) | $ | (96,845) | $ | (1,272,552) | $ | (702,300) | $ | (3,187,489) | $ | (720,869) | $ | (3,306,207) | $ | (576,944) | ||||||||||||||||||||||||||||||||||
Relationship Between CAP and Financial Performance Measures
The graphs below compare the compensation actually paid to our PEO and the average of the compensation actually paid to our remaining NEOs, with (i) our cumulative TSR,(ii) our Peer Group TSR,(iii) our net income/(loss),and (iv) our Same Store Hotel EBITDA, in each case, for the fiscal years ended December 31, 2020, 2021, 2022 and 2023.
TSR amounts reported in the graph assume an initial fixed investment of $100 and that all dividends, if any, were reinvested.
51
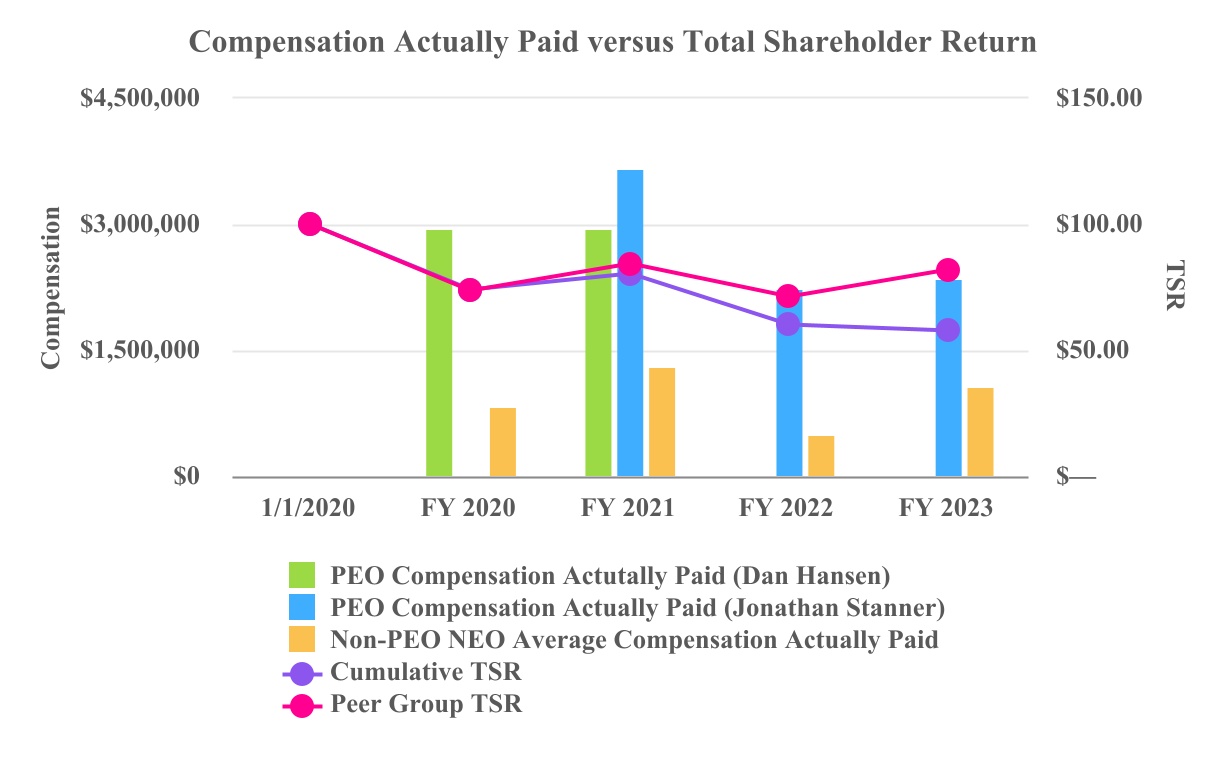
*Mr. Hansen served as PEO from January 1 to January 14, 2021. Mr. Stanner became PEO on January 15, 2021.
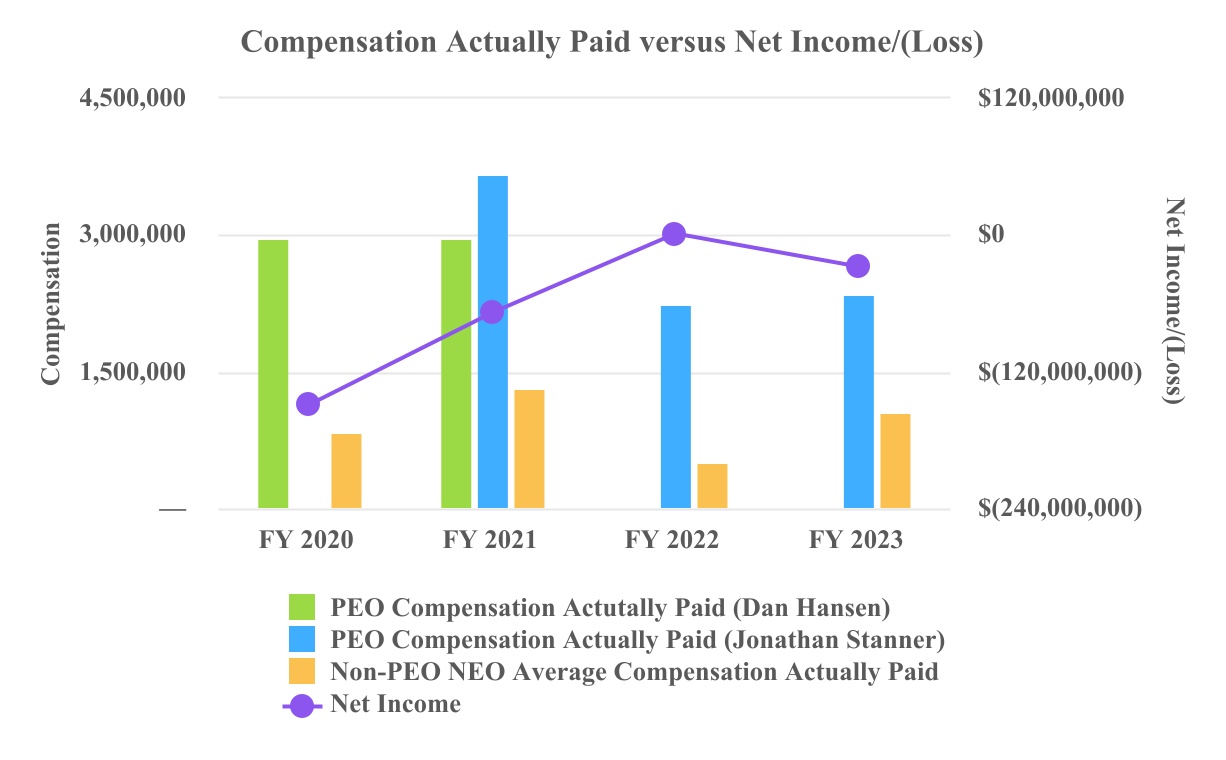
*Mr. Hansen served as PEO from January 1 to January 14, 2021. Mr. Stanner became PEO on January 15, 2021.
52
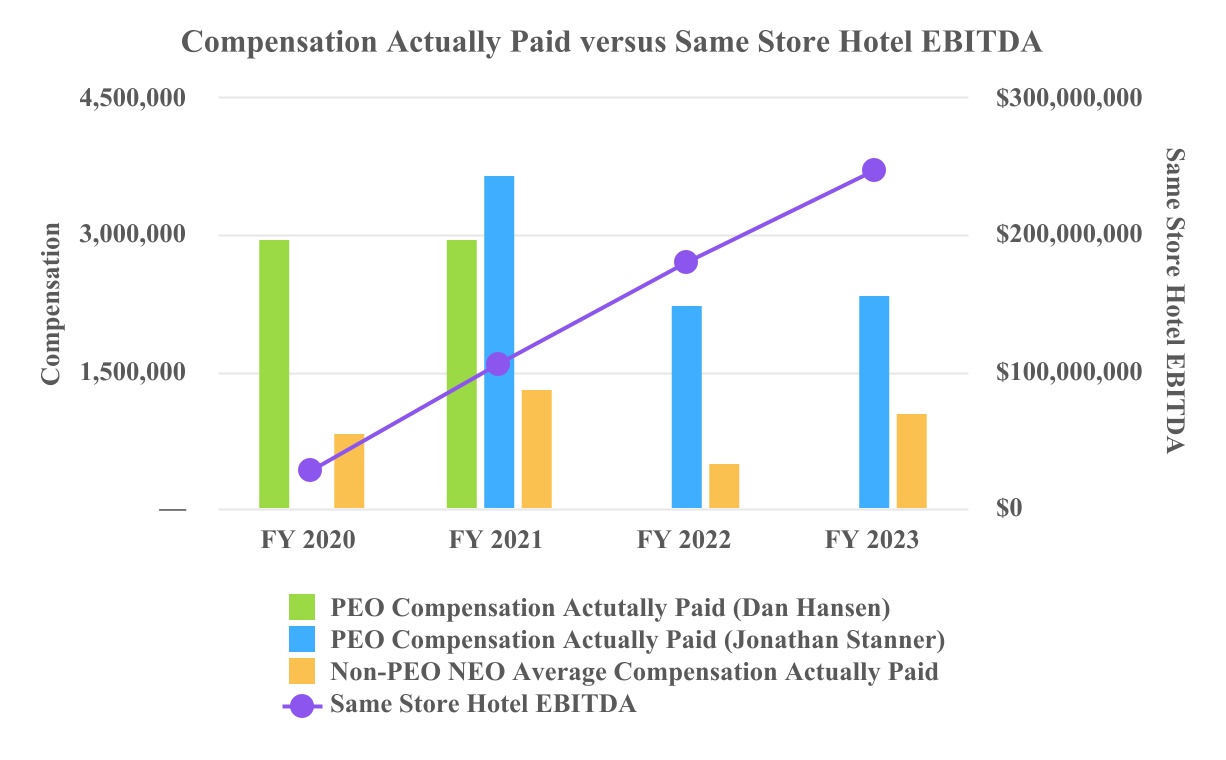
*Mr. Hansen served as PEO from January 1 to January 14, 2021. Mr. Stanner became PEO on January 15, 2021
Pay Versus Performance Tabular List
We believe the following performance measures represent the most important performance measures used by us to link compensation actually paid to our NEOs for the fiscal year ended December 31, 2023:
•Same Store Hotel EBITDA;
•Balance Sheet Enhancements;
•Transaction Activity;
•Capital Expenditure Metrics; and
•Relative and Absolute TSR.
For additional details regarding our most important financial performance measures, please see the section titled “Elements of 2023 Executive Compensation-Annual Cash Incentive Program” in our Compensation Discussion and Analysis (CD&A) elsewhere in this proxy statement.
Risk Considerations in our Executive Compensation Program
The Compensation Committee has assessed our compensation program for the purpose of reviewing and considering any risks presented by our compensation policies and practices that are likely to have a material adverse effect on us. As part of that assessment, management reviewed the primary elements of our compensation program, including base salary, annual bonus opportunities, equity compensation and severance arrangements. Management’s risk assessment included a review of the overall design of each primary element of our compensation program, and an analysis of the various design features, controls and approval rights in place with respect to compensation paid to management, and other employees, which mitigate potential risks to us that could arise from our compensation program. Following the assessment, the Compensation Committee determined that our compensation policies and practices did not create risks that were reasonably likely to have a material adverse effect on the Company.
53
AUDIT COMMITTEE REPORT
The Audit Committee (“Audit Committee”) of the Board of Directors (“Board”) of Summit Hotel Properties, Inc. (“Company”) oversees the Company’s financial reporting process on behalf of the Board, in accordance with the Audit Committee charter. Management has the primary responsibility for the financial statements and the reporting process, including the system of internal controls. In fulfilling its oversight responsibilities, the Audit Committee reviewed with management the audited consolidated financial statements included in the Company’s Annual Report on Form 10-K for the year ended December 31, 20212023 (“Annual Report”), and discussed with management the quality, not just the acceptability, of the Company’s accounting principles, the reasonableness of significant judgments and the clarity of disclosures in the financial statements. The Audit Committee also reviewed and discussed with management the Company’s year-end earnings release.
The Audit Committee reviewed with the independent registered public accountants, who are responsible for expressing an opinion on the conformity of the Company’s audited consolidated financial statements with generally accepted accounting principles, their judgments as to the quality, not just the acceptability, of the Company’s accounting principles and such other matters as are required to be discussed with the Audit Committee under generally accepted auditing standards. In addition, the Audit Committee has discussed with the independent registered public accountants the auditors’ independence, the matters required to be discussed by the applicable requirements of the Public Company Accounting Oversight Board ("PCAOB") and the Securities and Exchange Commission (“SEC”), and discussed and received the written disclosures and the letter from the independent registered public accountants required by the applicable requirements of the Public Company Accounting Oversight BoardPCAOB regarding the independent auditors’ communications with the Audit Committee concerning independence.
The Audit Committee discussed with the Company’s independent registered public accountants the overall scope and plans for their audit. As a result of travel and other restrictions stemming from the COVID-19 pandemic, theThe Audit Committee met twicefour times in person and fivethree times telephonicallyvia video teleconference in 2021,2023, with the independent registered public accountants, with and without management present, to discuss the results of their examinations, their evaluations of the Company’s internal controls and the overall quality of the Company’s financial reporting. The Audit Committee held meetings with management prior to the filing of each of the Company’s Quarterly Reports on Form 10-Q with the SEC and the release to the public of its quarterly earnings and reviewed and discussed with management the Company’s Quarterly Reports on Form 10-Q and its quarterly earnings releases.
In reliance on the reviews and discussions referred to above, the Audit Committee recommended to the Board (and the Board approved) that the audited consolidated financial statements be included in the Company’s Annual Report.
The Audit Committee is also responsible for monitoring the Company’s procedures for compliance with the rules for taxation as a real estate investment trust under Sections 856-860 of the Internal Revenue Code of 1986 as amended (“Code”). The Audit Committee determined that the Company was in compliance with the Code for 2021.2023.
The members of the Audit Committee are not professionally engaged in the practice of auditing or accounting. Members of the Audit Committee rely, without independent verification, on the information provided to them and on the representations made by management and the independent registered public accountants. Accordingly, the Audit Committee’s oversight does not provide an independent basis to determine that management has maintained appropriate accounting and financial reporting principles, or appropriate internal controls and procedures designed to assure compliance with accounting standards and applicable laws and regulations. Furthermore, the Audit Committee’s considerations and discussions referred to above do not assure that the audit of the Company’s financial statements has been carried out in accordance with generally accepted auditing standards, that the financial statements are presented in accordance with generally accepted accounting principles or that Ernst & Young, LLP, the Company’s independent registered public accounting firm for the year ended December 31, 2021,2023, was in fact “independent.”
54
The Audit Committee has adopted a written charter that outlines certain specified responsibilities of the Audit Committee and complies with the rules of the SEC and the New York Stock Exchange (“NYSE”).
Each of the Audit Committee members is independent as defined by the NYSE listing standards and each member is financially literate. The Board has identified Bjorn R. L. Hanson, Jeffrey W. Jones, Kenneth J. Kay and Hope S. Taitz as “audit committee financial experts” within the meaning of the SEC rules.
Audit Committee of the Board:
Jeffrey W. Jones (Chair)
Bjorn R. L. Hanson
Kenneth J. Kay
Hope S. Taitz
April 3, 2024
55
Principal Accountant Fees and Services
The following is a summary of the fees billed to the Company by EY, the Company’s current independent registered public accounting firms for professional services rendered for the years ended December 31, 20212023 and 2020:
| | | | Year Ended December 31, 2021 | | | Year Ended December 31, 2020 | | ||||||
| Audit Fees | | | | $ | 1,033,650* | | | | | $ | 921,250 | | |
| Audit-Related Fees | | | | | 5,000 | | | | | | 4,421 | | |
| Tax Fees | | | | | — | | | | | | 38,625 | | |
| All Other Fees | | | | | — | | | | | | — | | |
| Total | | | | $ | 1,038,650* | | | | | $ | 964,296 | | |
| Year Ended | |||||||||||||||||
| December 31, 2023 | December 31, 2022 | ||||||||||||||||
| Audit Fees | $ | 1,460,750 | (1) | $ | 1,565,000 | (2) | |||||||||||
| Audit-Related Fees | — | — | |||||||||||||||
| Tax Fees | 47,500 | 74,350 | |||||||||||||||
| All Other Fees | — | — | |||||||||||||||
| Total | $ | 1,508,250 | $ | 1,639,350 | |||||||||||||
(1)Includes fees totaling $61,250$127,000 paid by the Company’s Joint Venture partner pursuant to joint venture partnership agreement.
Audit Fees
“Audit Fees” consist of fees and expenses billed for professional services rendered for the audit of the annual consolidated financial statements, review of the interim consolidated financial statements, review of registration statements, and the preparation of comfort letters and services that are normally provided by accountants in connection with statutory and regulatory filings or engagements.
Audit-Related Fees
“Audit-Related Fees” consist of fees and expenses for assurance and related services that are reasonably related to the performance of the audit or review of our financial statements that are not “Audit Fees.”
Tax Fees
“Tax Fees” consist of fees and related expenses billed for professional services for tax compliance, tax advice and tax planning. These services include assistance regarding federal and state tax compliance and tax planning and structuring.
All Other Fees
“All Other Fees” consist of fees and expenses for products and services that are not “Audit Fees,” “Audit-Related Fees” or “Tax Fees”.Fees.”
Pre-Approval Policy
All fees for audit, tax and other services provided to us are reviewed and pre-approved by the Audit Committee. The Audit Committee concluded that the provision of such services by EY in 20212023 were compatible with the maintenance of EY’sEY's independence in the conduct of its auditing functions. All the fees paid to EY in 20202022 and 20212023 that are described above were pre-approved by the Audit Committee.
56
SECURITY OWNERSHIP OF CERTAIN BENEFICIAL OWNERS AND MANAGEMENT
Security Ownership of Certain Beneficial Owners
The following table sets forth the beneficial ownership of our common stock and common units of limited partnership in the Operating Partnership (“OP Units”), as of March 11, 2022,6, 2024, for each stockholder and unitholder that is known by us to be the beneficial owner of more than five percent of our common stock or OP Units based upon filings made with the SEC by such stockholders and unitholders. OP Units may be redeemed for cash or, at our election, shares of common stock on a one-for-one basis.
| Name of Beneficial Owner | | | Number of Shares of Common Stock and OP Units Beneficially Owned | | | Percentage of All Shares(1) | | | Percentage of All Shares and OP Units(2) | | |||||||||
BlackRock, Inc.(3) | | | | | 18,890,040 | | | | | | 17.66% | | | | | | 15.43% | | |
The Vanguard Group, Inc.(4) | | | | | 15,085,524 | | | | | | 14.10% | | | | | | 12.32% | | |
Bright Force Investment, LLC(5) | | | | | 13,990,697 | | | | | | 13.08% | | | | | | 11.43% | | |
Barclays PLC(6) | | | | | 8,346,570 | | | | | | 7.80% | | | | | | 6.82% | | |
State Street Corporation(7) | | | | | 6,191,987 | | | | | | 5.79% | | | | | | 5.06% | | |
| Name of Beneficial Owner | Number of Shares of Common Stock and OP Units Beneficially Owned | Percentage of All Shares(1) | Percentage of All Shares and OP Units(2) | |||||||||||||||||
BlackRock, Inc.(3) | 21,046,483 | 19.56% | 17.04% | |||||||||||||||||
Bright Force Investment, LLC(4) | 14,906,084 | 13.85% | 12.07% | |||||||||||||||||
The Vanguard Group, Inc.(5) | 14,691,296 | 13.65% | 11.89% | |||||||||||||||||
State Street Corporation(6) | 6,999,270 | 6.51% | 5.67% | |||||||||||||||||
JP Morgan Chase & Co. (7) | 6,656,890 | 6.19% | 5.39% | |||||||||||||||||
Prudential Financial, Inc. (8) | 5,282,282 | 4.91% | 4.28% | |||||||||||||||||
Jennison Associates, LLC (9) | 4,977,915 | 4.63% | 4.03% | |||||||||||||||||
(1)Based on 106,337,785107,593,373 shares of our common stock issued and outstanding as of March 11, 2022.6, 2024. The total number of shares of our common stock used in calculating each percentage shown includes all shares of our common stock that each beneficial owner has the right to acquire within 60 days of March 11, 20226, 2024 (pursuant to the exercise of stock options or upon the redemption of OP units), but such shares are not deemed to be outstanding for the purpose of computing the ownership percentage of any other beneficial owner.
(2)
Based on 121,777,076123,542,001 shares of our common stock and OP units issued and outstanding as of March 11, 2022.6, 2024. The total number of shares of our common stock and OP units outstanding used in calculating each percentage shown includes all shares and units that each person has the right to acquire within 60 days of March 11, 20226, 2024 (pursuant to the exercise of stock options or upon the redemption of OP units) are outstanding, but such shares and units are not deemed to be outstanding for the purpose of computing the ownership percentage of any other beneficial owner.
(3)
Based solely on information contained in a Schedule 13G/A filed by BlackRock, Inc. (“BlackRock”), with the SEC on January 27, 2022.19, 2024. BlackRock hadbeneficially owns 21,046,483 shares of common stock, with sole voting power over 18,890,040to vote on 20,403,016 of such shares, shared power to vote on none of such shares, sole power to dispose of 21,046,483 of such shares, and sole dispositiveshared power to dispose of none of such shares through itself and being the parent holding company or control person over 19,764,677 shares.each of the following subsidiaries: BlackRock Advisors, LLC, Aperio Group, LLC, BlackRock (Netherlands) B.V., BlackRock Fund Advisors, BlackRock Institutional Trust Company, National Association, BlackRock Asset Management Ireland Limited, BlackRock Financial Management, Inc., BlackRock Japan Co., Ltd., BlackRock Asset Management Schweiz AG, BlackRock Investment Management, LLC, BlackRock Investment Management (UK) Limited, BlackRock Asset Management Canada Limited, BlackRock Investment Management (Australia) Limited, and BlackRock Fund Managers Ltd. BlackRock has its principal business office at 55 East 52nd Street,50 Hudson Yards, New York, NY 10055.10001.
(4)
The number of OP units and the information in this footnote are based on the Schedule 13D filed with the SEC on July 25, 2022 by Bright Force Investment, LLC (“Bright Force”). Bright Force had shared voting and dispositive power over 14,540,877 units. The units are held directly by Bright Force, which is a wholly owned subsidiary of NewcrestImage Holdings, LLC (“NewcrestImage”). An additional 365,207 units are held directly by Supreme Bright New Orleans II, LLC, an indirect wholly-owned subsidiary of Newcrest. Newcrest may be deemed to share the voting and dispositive power with respect to these units. The address of Bright Force is 1785 State Highway 26, Suite 400, Grapevine, TX 76051.
The number of OP units and the information in this footnote are based on the Schedule 13D filed with the SEC on July 25, 2022 by Bright Force Investment, LLC (“Bright Force”). Bright Force had shared voting and dispositive power over 14,540,877 units. The units are held directly by Bright Force, which is a wholly owned subsidiary of NewcrestImage Holdings, LLC (“NewcrestImage”). An additional 365,207 units are held directly by Supreme Bright New Orleans II, LLC, an indirect wholly-owned subsidiary of Newcrest. Newcrest may be deemed to share the voting and dispositive power with respect to these units. The address of Bright Force is 1785 State Highway 26, Suite 400, Grapevine, TX 76051.
57
(5)Based solely on information contained in a Schedule 13G/A filed by The Vanguard Group, Inc. (“Vanguard Group”), with the SEC on February 10, 2022.13, 2024. The Vanguard Group hasbeneficially owns 14,691,296 shares of common stock, with sole power to vote on none of such shares, shared voting power over 188,841to vote 157,118 of such shares, sole dispositive power over 14,896,683to dispose 14,431,611 of such shares, and shared dispositive power over 282,006to dispose of 259,685 of such shares. The Vanguard Group has its principal business office at 100 Vanguard Blvd.,Boulevard, Malvern, PA 19355.
(7)Based solely on information contained in a Schedule 13G filed by JP Morgan Chase & Co. (“JP Morgan”), with the SEC on January 25, 2024. JP Morgan beneficially owns 6,656,890 shares of common stock, with sole power to vote 6,511,092 of such shares, shared power to vote none of such shares, sole power to dispose 6,636,880 of such shares, and shared power to dispose of none of such shares through itself and being the parent holding company or control person over each of the following subsidiaries: J.P. Morgan Trust Company of Delaware, J.P. Morgan Securities LLC, JPMorgan Chase Bank, National Association, JPMorgan Asset Management (UK) Limited, J.P. Morgan Investment Management Inc., J.P. Morgan Private Wealth Advisors, LLC. JP Morgan has its principal business office at 383 Madison Avenue, New York, NY 10179.
(8)Based solely on information contained in a Schedule 13G filed by Prudential Financial, Inc. (“Prudential”), with the SEC on February 14, 2024. The shares listed in the table are beneficially owned by the following subsidiaries of Prudential: Jennison Associates, LLC, PGIM, Inc., PGIM Quantitative Solutions LLC and PRUCO Securities, LLC. Prudential has sole power to vote 113,277 of such shares, shared power to vote 5,169,005 of such shares, sole power to dispose 113,227 of such shares, and shared power to dispose of 5,169,005 of such shares. Prudential has its principal business office at 751 Broad Street, Newark, NJ 07102-3777.
(9)Based solely on information contained in a Schedule 13G filed by Jennison Associates (“Jennison”), with the SEC on February 8, 2024. Jennison furnishes investment advice to several investment companies, insurance separate accounts, and institutional clients (“Managed Portfolios”). As a result of its role as investment advisor of the Managed Portfolios, Jennison may be deemed to be the beneficial owner of the shares of the Company’s common stock held by such Managed Portfolios. Prudential Financial, Inc. (“Prudential”) indirectly owns 100% of the equity interests of Jennison. As a result, Prudential may be deemed to have the power to exercise or to direct the exercise of such voting and/or dispositive power that Jennison may have with respect to the common stock held by the Managed Portfolios. Jennison does not file jointly with Prudential, as such, shares reported on Jennison's 13G may be included in the shares reported on the 13G filed by Prudential. Jennison has its principal business office at 466 Lexington Avenue, New York, NY 10017.
58
Security Ownership of Management (Executive Officers and Directors)
The following table sets forth the beneficial ownership of our common stock as of March 25, 2022,31, 2024, for each of our named executive officers, each of our directors and all our executive officers and directors as a group.
Name of Beneficial Owner(1) | | | Number of Shares Beneficially Owned | | | Percentage of All Shares(2) | | ||||||
Jonathan P. Stanner(4) | | | | | 799,607 | | | | | | * | | |
Daniel P. Hansen(3) | | | | | 681,966 | | | | | | * | | |
William H. Conkling(4) | | | | | 295,895 | | | | | | * | | |
Christopher R. Eng(4) | | | | | 239,633 | | | | | | * | | |
Paul Ruiz(4) | | | | | 209,710 | | | | | | * | | |
| Thomas W. Storey | | | | | 141,908 | | | | | | * | | |
| Bjorn R. L. Hanson | | | | | 84,811 | | | | | | * | | |
| Jeffrey W. Jones | | | | | 71,383 | | | | | | * | | |
| Kenneth J. Kay | | | | | 71,383 | | | | | | * | | |
| Hope S. Taitz | | | | | 48,300 | | | | | | * | | |
| Amina Belouizdad | | | | | 10,091 | | | | | | * | | |
Mehul Patel(5) | | | | | 485,529 | | | | | | * | | |
| All directors and executive officers as a group (12 persons) | | | | | 3,140,216 | | | | | | 2.94% | | |
Name of Beneficial Owner(1) | Number of Shares Beneficially Owned | Percentage of All Shares(2) | ||||||||||||
Jonathan P. Stanner(3) | 1,426,675 | 1.32% | ||||||||||||
William H. Conkling(3) | 523,358 | * | ||||||||||||
Christopher R. Eng(3) | 310,072 | * | ||||||||||||
Paul Ruiz(3) | 276,583 | * | ||||||||||||
Mehulkumar B. Patel(4) | 507,357 | * | ||||||||||||
| Thomas W. Storey | 169,736 | * | ||||||||||||
| Bjorn R. L. Hanson | 112,639 | * | ||||||||||||
| Jeffrey W. Jones | 99,211 | * | ||||||||||||
| Kenneth J. Kay | 99,211 | * | ||||||||||||
| Hope S. Taitz | 81,128 | * | ||||||||||||
| Amina Belouizdad Porter | 37,919 | * | ||||||||||||
| All directors and executive officers as a group (11 persons) | 3,643,889 | 3.37% | ||||||||||||
* Represents less than one percent of the outstanding shares of common stock.
(1)
Unless otherwise indicated in the following footnotes, each person has sole voting and investment power with respect to all the shares of common stock shown as beneficially owned by such person. The address of each named person is Summit Hotel Properties, Inc., 13215 Bee Cave Parkway, Suite B-300, Austin, Texas 78738.
(2)
Based on shares of our common stock issued and outstanding as of March 25, 2022.31, 2024. The total number of shares of our common stock outstanding used in calculating this percentage assumes that all shares of our common stock that each person has the right to acquire within 60 days of March 25, 2022,31, 2024, (pursuant to the exercise of stock options or upon the redemption of common units) are deemed to be outstanding but are not deemed to be outstanding for the purpose of computing the ownership percentage of any other person.
(3)
Includes unvested restricted shares of our common stock issued under our Equity Incentive Plan. Includes 153,590 shares held through family company.
(4) Includes 479,295 shares of common stock issuable upon redemption of OP Units in the Operating Partnership after July 13, 2022 on a one-for-one basis. The OP Units are held through a family company.
59
CERTAIN RELATIONSHIPS AND RELATED TRANSACTIONS
Related Person Transaction Policy
We have adopted a written policy for the review and approval of related person transactions requiring disclosure under Item 404(a) of Regulation S-K. This policy provides that the Nominating and Corporate Governance Committee is responsible for reviewing and approving or disapproving all related person transactions, meaning any transaction, arrangement or relationship in which (i) the amount involved may be expected to exceed $120,000 in any fiscal year, (ii) our Company or one of our subsidiaries will be a participant and (iii) a related person has a direct or indirect material interest. A related person is defined as an executive officer, director or nominee for election as director, or a greater than 5% beneficial owner of our common stock, or an immediate family member of the foregoing. The Nominating and Corporate Governance Committee may deem certain related person transactions to be pre-approved.
Related Person Transactions
In Januarythe first quarter 2022, the Company acquired 27 hotels and two parking structures from affiliates of NewcrestImage Holdings, LLC (“NewcrestImage”) through its joint venture with GIC, Singapore’s sovereign wealth fund (“Joint Venture”). The initial closing included 26 of 27 hotels totaling 3,533 guestrooms, two parking structures, and various financial incentives. The remaining hotel, the newly constructed 176-guestroom Canopy by Hilton New Orleans, was acquired upon its opening in March 2022. The total consideration for the transaction was comprised of $776.5 million, or $209,000 per key, for the 27-hotel portfolio, $24.8 million for the two parking structures, and $20.7 million for the various financial incentives. The transaction was creatively structured to preserve nearly all the Company’s existing liquidity and is expected to be immediately accretive to earnings, leverage neutral to our balance sheet and preserve ample investment capacity. The Company funded its 51% equity contribution through the issuance of common operating partnership units valued at $160 million and preferred operating partnership units with an annual coupon of 5.25% valued at $50 million. The Joint Venture secured a $410 million term loan and GIC’s equity contribution of $208 million was funded in cash.
Director Nomination Agreement
In connection with the acquisition of hotels from affiliates of NewcrestImage, in January 2022, the Company entered into a Director Nomination Agreement with Bright Force Investment, LLC (“Bright Force”), Sagestar Family, LLC (“Sagestar Family”) and C&D Family Holdings, LLC (“C & D Family Holdings”), each of which is an affiliate of NewcrestImage. Pursuant to the Director Nomination Agreement, for so long as the total number of shares of the Company’s common stock and the Operating Partnership’s common units owned of record by Bright Force, Sagestar Family and C&D Family Holdings or their affiliates is equal to at least 10% of the sum of (X) the number of the Company’s common stock outstanding plus (Y) the number of the Operating Partnership’s common units outstanding that are not owned directly or indirectly by the Company, Bright Force, Sagestar Family and C&D Family Holdings and such affiliates will have the collective right to designate one individual as a nominee for election to the Company’s Board at each annual meeting of the stockholders of the Company (or special meeting of the stockholders in lieu of an annual meeting at which Directors are to be elected). The current nominee designated under the Director Nomination Agreement is Company director, Mr. Mehulkumar Patel.
Registration Rights Agreement
In connection with the acquisition of hotels from affiliates of NewcrestImage, in January 2022, the Company entered into a Registration Rights Agreement with Bright Force, Sagestar Family and C&D Family Holdings. Pursuant to the Registration Rights Agreement, the Company has agreed to filefiled with the SEC, on or before July 13,May 9, 2022, a registration statement on Form S-3 to register the issuance or resale, as applicable, of the Company’s common stock issuable upon redemption of, or in exchange for, the Operating Partnership’s common units received upon closing of the acquisitions from NewcrestImage and to use its reasonable best efforts to have such registration statement declared effective by the SEC as soon as practicable after filing such registration statement.
NewcrestImage.Tax Protection Agreement
In connection with the acquisition of hotels from affiliates of NewcrestImage, in January 2022, the Company entered into a Tax Protection Agreement with NewcrestImage. Pursuant to the Tax Protection Agreement, the Company has agreed to indemnify NewcrestImage for certain tax liabilities resulting from the sale, exchange, transfer or other disposition of a property contributed by NewcrestImage.
60
OTHER INFORMATION
Discretionary Voting Authority
We do not anticipate that any matter other than the proposals set out in this proxy statement will be raised at the annual meeting. If any other matters are properly presented at the annual meeting, the persons named as proxies will have discretion to vote on those matters according to their discretion.
Section 16(a) Beneficial Ownership Reporting Compliance
Section 16(a) of the Exchange Act requires our executive officers and directors, and any person who owns more than ten percent of our common stock, to file with the SEC initial reports of beneficial ownership and certain changes in that beneficial ownership, with respect to our equity securities. During 2023, all Section 16(a) reporting requirements applicable to our directors and executive officers were satisfied.
Stockholder Proposals and Director Nominations for the 20232025 Annual Meeting of Stockholders
Requirements for Proposals to be Considered for Inclusion in Proxy Materials
Stockholders interested in submitting a proposal for inclusion in the proxy materials for our 20232025 annual meeting of stockholders may do so by following the procedures prescribed in Rule 14a-8 under the Exchange Act. To be eligible for inclusion in our proxy statement, stockholder proposals must be received no later than November 30, 2022,December 4, 2024, the date 120 calendar days before the first anniversary of the date of this proxy statement and must comply with Rule 14a-8 under the Exchange Act regarding the inclusion of stockholder proposals in company-sponsored proxy materials. If we change the date of the 20232025 annual meeting of stockholders by more than 30 days from the anniversary of this year’s meeting, stockholder proposals must be received a reasonable time before we begin to print and mail our proxy materials for the 20232025 annual meeting of stockholders. Proposals should be mailed to our Secretary at the following address:
Summit Hotel Properties, Inc.
13215 Bee Cave Parkway, Suite B-300
Austin, Texas 78738
Attention: Secretary
Requirements for Proposals Not Intended for Inclusion in Proxy Materials; Director Nominations
Stockholders who wish to nominate persons for election to the Board at the 20232025 annual meeting of stockholders or who wish to present a proposal at the 20232025 annual meeting of stockholders, but whose stockholder proposal will not be included in the proxy materials we distribute for such meeting, must deliver written notice of the nomination or proposal to our Secretary no earlier than October 31, 2022November 4, 2024 and no later than November 30 , 2022December 3, 2024 (provided, however, that if the 20232025 annual meeting of stockholders is advanced or delayed by more than 30 days from the first anniversary of this year’s meeting, nominations and proposals must be received no earlier than the 150th day prior to the date of the 20232025 annual meeting of stockholders and no later than the later of the 120th day prior to the date of the 20232025 annual meeting of stockholders or the 10th day following the day on which public announcement of the date of the 20232025 annual meeting of stockholders is first made). The stockholder’s written notice must include certain information concerning the stockholder and each nominee as specified in our Bylaws. If a stockholder’s written notice is not received between the dates specified above and does not satisfy these additional informational requirements, the notice will not be considered properly submitted and will not be acted upon at the 20232025 annual meeting of stockholders. A stockholder’s written notice should be sent to our Secretary at the following address:
Summit Hotel Properties, Inc.
13215 Bee Cave Parkway, Suite B-300
Austin, Texas 78738
Attention: Secretary
61
Solicitation of Proxies for 20232025 Annual Meeting of Stockholders
We intend to file a proxy statement and WHITE proxy card with the SEC in connection with our solicitation of proxies for our 20232025 annual meeting of stockholders. Stockholders may obtain our proxy statement (and any amendments and supplements thereto) and other documents as and when filed by the Company with the SEC without charge from the SEC’s website at: www.sec.gov.
www.sec.gov.Requests for Annual Report
A copy of our Annual Report, including the consolidated financial statements and the financial statement schedules, may be obtained at our website at www.shpreit.com.www.shpreit.com. If you would like to receive a complimentary copy of our Annual Report, please submit a written request to:
Summit Hotel Properties, Inc.
13215 Bee Cave Parkway, Suite B-300
Austin, Texas 78738
Attention: Investor Relations
BY ORDER OF THE BOARD OF DIRECTORS
Christopher Eng
Executive Vice President, General Counsel,
Chief Risk Officer and Secretary
Austin, Texas
March 30, 2022
April 3, 2024
62
Reconciliation of Non-GAAP Financial Measures from GAAP
We disclose certain “non-GAAP financial measures,” which are measures of our historical financial performance. Non-GAAP financial measures are financial measures not prescribed by GAAP. These measures are as follows: (i) Funds From Operations (“FFO”) and Adjusted Funds from Operations ("AFFO"), (ii) EBITDA, Earnings before Interest, Taxes, Depreciation and Amortization for Real Estate ("EBITDAre") and Adjusted EBITDAre (as described below). We caution investors that amounts presented in accordance with our definitions of non-GAAP financial measures may not be comparable to similar measures disclosed by other companies, since not all companies calculate these non-GAAP financial measures in the same manner. Our non-GAAP financial measures should be considered along with, but not as alternatives to, net income (loss) as a measure of our operating performance. Our non-GAAP financial measures may include funds that may not be available for our discretionary use due to functional requirements to conserve funds for capital expenditures, property acquisitions, debt service obligations and other commitments and uncertainties. Although we believe that our non-GAAP financial measures can enhance the understanding of our financial condition and results of operations, these non-GAAP financial measures are not necessarily better indicators of any trend as compared to a comparable measure prescribed by GAAP such as net income (loss).
FFO and AFFO
As defined by Nareit, FFO represents net income or loss (computed in accordance with GAAP), excluding preferred dividends, gains (or losses) from sales of real property, impairment losses on real estate assets, items classified by GAAP as extraordinary, the cumulative effect of changes in accounting principles, plus depreciation and amortization related to real estate assets, and adjustments for unconsolidated partnerships, and joint ventures. AFFO represents FFO excluding amortization of deferred financing costs, franchise fees, equity-based compensation expense, transaction costs, debt transaction costs, premiums on redemption of preferred shares, losses from net casualties, non-cash interest income and non-cash income tax related adjustments to our deferred tax asset. Unless otherwise indicated, we present FFO and AFFO applicable to our common shares and common units. We present FFO and AFFO because we consider FFO and AFFO an important supplemental measure of our operational performance and believe it is frequently used by securities analysts, investors and other interested parties in the evaluation of REITs, many of which present FFO and AFFO when reporting their results. FFO and AFFO are intended to exclude GAAP historical cost depreciation and amortization, which assumes that the value of real estate assets diminishes ratably over time. Historically, however, real estate values have risen or fallen with market conditions. Because FFO and AFFO exclude depreciation and amortization related to real estate assets, gains and losses from real property dispositions and impairment losses on real estate assets, and certain transaction costs related to lodging property acquisition activities and debt, FFO and AFFO provide performance measures that, when compared year over year, reflect the effect to operations from trends in occupancy, guestroom rates, operating costs, development activities and interest costs, providing perspective not immediately apparent from net income. Our computation of FFO differs slightly from the computation of Nareit-defined FFO related to the reporting of depreciation and amortization expense on assets at our corporate offices, which is de minimus. Our computation of FFO may also differ from the methodology for calculating FFO used by other equity REITs and, accordingly, may not be comparable to such other REITs. FFO and AFFO should not be considered as an alternative to net income (loss) (computed in accordance with GAAP), as an indicator of our liquidity, nor is it indicative of funds available to fund our cash needs, including our ability to pay dividends or make distributions. Where indicated in this Annual Report on Form 10-K, FFO is based on our computation of FFO and not the computation of Nareit-defined FFO unless otherwise noted.
63
The following is a reconciliation of our GAAP net income to FFO and AFFO for the years ended December 31, 2023, 2022 and 2021 (in thousands, except per common share/common unit amounts):
| 2023 | 2022 | 2021 | ||||||||||||||||||
| Net (loss) income | $ | (28,116) | $ | 1,217 | $ | (68,584) | ||||||||||||||
| Preferred dividends | (15,875) | (15,875) | (15,431) | |||||||||||||||||
| Distributions to and accretion of redeemable non-controlling interests | (2,626) | (2,520) | — | |||||||||||||||||
| Premium on redemption of preferred stock | — | — | (2,710) | |||||||||||||||||
| Loss (income) related to non-controlling interests in consolidated joint ventures | 14,824 | (2,321) | 2,896 | |||||||||||||||||
| Net loss applicable to common shares and common units | (31,793) | (19,499) | (83,829) | |||||||||||||||||
| Real estate-related depreciation | 146,187 | 145,492 | 105,462 | |||||||||||||||||
| Loss on write-down of assets | 16,661 | 10,420 | 4,361 | |||||||||||||||||
| Loss (gain) on disposal of assets and other dispositions, net | 385 | (20,315) | (240) | |||||||||||||||||
| Adjustments related to non-controlling interests in consolidated joint ventures | (34,662) | (20,845) | (8,454) | |||||||||||||||||
| FFO applicable to common shares and common units | 96,778 | 95,253 | 17,300 | |||||||||||||||||
| Recoveries of credit losses | (1,230) | (1,100) | (2,632) | |||||||||||||||||
| Amortization of lease-related intangible assets | — | — | 87 | |||||||||||||||||
| Amortization of deferred financing costs | 5,910 | 5,708 | 4,353 | |||||||||||||||||
| Amortization of franchise fees | 595 | 663 | 493 | |||||||||||||||||
| Amortization of intangible assets, net | 3,642 | 3,643 | — | |||||||||||||||||
Equity-based compensation (1) | 7,743 | 8,446 | 10,681 | |||||||||||||||||
Executive transition costs (2) | — | — | 1,065 | |||||||||||||||||
| Transaction costs | 13 | 749 | 3,849 | |||||||||||||||||
| Debt transaction costs | 461 | 1,528 | 220 | |||||||||||||||||
| Premium on redemption of preferred stock | — | — | 2,710 | |||||||||||||||||
| Non-cash interest income | (531) | (113) | (1,042) | |||||||||||||||||
| Non-cash lease expense, net | 481 | 505 | 521 | |||||||||||||||||
| Casualty losses, net | 2,112 | 2,505 | 468 | |||||||||||||||||
| Decrease in deferred tax asset valuation allowance | 84 | — | — | |||||||||||||||||
| Adjustments related to non-controlling interests in consolidated joint ventures | (3,612) | (3,400) | (1,291) | |||||||||||||||||
Special allocation related to sale of joint venture asset(3) | — | (417) | — | |||||||||||||||||
| Non-cash state taxes and other, net | 447 | — | — | |||||||||||||||||
| AFFO applicable to common shares and common units | $ | 112,893 | $ | 113,970 | $ | 36,782 | ||||||||||||||
| FFO per common share/common unit | $ | 0.79 | $ | 0.79 | $ | 0.16 | ||||||||||||||
AFFO per common share/common unit (4) | $ | 0.92 | $ | 0.94 | $ | 0.35 | ||||||||||||||
| Weighted average diluted common shares/common units: | ||||||||||||||||||||
FFO and AFFO (5)(6) | 122,355 | 121,163 | 105,455 | |||||||||||||||||
(1) The total equity-based compensation expense for the years ended December 31, 2022 and 2021 includes $1.3 million and $2.9 million, respectively, of incremental expense related to the modification of certain restricted stock awards as a result of the departure of our Chief Operating Officer and Executive Chairman.
(2) Executive transition costs are cash payments due to our former Executive Chairman as a result of the non-renewal of his employment contract in December 2021.
(3) During the year ended December 31, 2022, we earned a $0.4 million promote related to the sale by the GIC Joint Venture of the sale of a 169-guestroom Hilton Garden Inn San Francisco Airport North in San Francisco, CA for a gross selling price of $75.0 million. The sale of this property resulted in a net gain of $20.5 million to the GIC Joint Venture. Our promote is earned when the internal rate of return to GIC related to capital transactions exceeds a specified investment hurdle rate. We have adjusted this amount from our calculation of AFFO because it relates to the gain on the sale of the property and not on-going operations.
(4) AFFO for the years ended December 31, 2023, 2022 and 2021 has not been adjusted for interest related to the Convertible Notes for purposes of calculating AFFO per common share/common unit because we intend to settle the principal portion of the Convertible Notes in cash and we did not include in the denominator of our calculation of AFFO per common share/common unit the potential dilutive effect of shares that would be issued if the principal portion of the Convertible Notes were converted into shares of our common stock.
(5) Includes Common Units in the Operating Partnership held by limited partners (other than us and our subsidiaries) because the Common Units are redeemable for cash or, at our election, shares of our common stock.
(6) The weighted average diluted common shares/common units used to calculate FFO and AFFO per common share/common unit for the years ended December 31, 2023, 2022 and 2021 includes the dilutive effect of our outstanding restricted stock awards. These shares were excluded from our weighted average shares outstanding used to calculate net loss per share because they would have been antidilutive. The weighted average common shares/common units used to calculate FFO and AFFO per common share/common unit for the year ended December 31, 2021 exclude the potential dilution related to our Convertible Notes as we intend to settle the principal value of the Convertible Notes in cash.
EBITDA, EBITDAre and Adjusted EBITDAre
EBITDA
EBITDA represents net income or loss, excluding: (i) interest, (ii) income tax expense and (iii) depreciation and amortization. We believe EBITDA is useful to an investor in evaluating our operating performance because it provides investors with an indication of our ability to incur and service debt, to satisfy general operating expenses, to make capital expenditures and to fund other cash needs or reinvest cash into our business. We also believe it helps investors meaningfully evaluate and compare the results of our operations from period to period by removing the effect of our asset base (primarily depreciation and amortization) from our operating results. Our management team also uses EBITDA as one measure in determining the value of acquisitions and dispositions.
EBITDAre and Adjusted EBITDAre
![[MISSING IMAGE: tm2210311d1-px_01scanbw.jpg]](https://capedge.com/proxy/DEF 14A/0001104659-22-040182/tm2210311d1-px_01scanbw.jpg)
EBITDAre, as defined by Nareit, is calculated as EBITDA, excluding: (i) loss and gains on disposition of property and (ii) asset impairments, if any. We believe EBITDAre is useful to transmit your voting instructionsan investor in evaluating our operating performance because it provides investors with an indication of our ability to incur and for electronic delivery of information. Vote by 11 5 P.M. ET on 5/11/ave your proxy card in hand whenyou access the web site and follow the instructionsservice debt, to obtain your recordssatisfy general operating expenses, to make capital expenditures and to createfund other cash needs or reinvest cash into our business. We also believe it helps investors meaningfully evaluate and compare the results of our operations from period to period by removing the effect of our asset base (primarily depreciation and amortization) from our operating results.
We make additional adjustments to EBITDAre when evaluating our performance because we believe that the exclusion of certain additional non-recurring or unusual items described below provides useful supplemental information to investors regarding our ongoing operating performance. We believe that the presentation of Adjusted EBITDAre, when combined with the primary GAAP presentation of net income, is useful to an electronic voting instruction form.ELECTRO IC DELIVERY OF FUTURE PROXY MATERIALSIf you would likeinvestor in evaluating our operating performance because it provides investors with an indication of our ability to reduceincur and service debt, to satisfy general operating expenses, to make capital expenditures and to fund other cash needs or reinvest cash into our business. We also believe it helps investors meaningfully evaluate and compare the costs incurredresults of our operations from period to period by removing the effect of our company in mailing proxy materials, you can consent to receiving all future proxy statements, proxy cardsasset base (primarily depreciation and annual reports electronically via e-mail or the Internet. To sign up for electronic delivery, please follow the instructions above to vote using the Internet and, when prompted, indicate that you agree to receive or access proxy materials electronically in future years.VOTE Y PHO E - 1-800-690-6903 se any touch-tone telephone to transmit your voting instructions. Vote by 11 5 P.M. ET on 5/11/ . ave your proxy card in hand when you call and then follow the instructions.VOTE Y MAILMark, sign and date your proxy card and return it in the postage-paid envelope we have provided or return it to Vote Processing, c/o Broadridge, 51 Mercedes Way, Edgewood, NY 11717. TO VOTE, MARK BLOCKS BELOW IN BLUE OR BLACK INK AS FOLLOWS:THIS PROXY CARD IS VALID ONLY WHEN SIGNED AND DATED. KEEP THIS PORTION FOR YOUR RECORDS DETACH AND RETURN THIS PORTION ONLY The Board of Directors recommends you vote FOR the following:1.Election of DirectorsNomineesForAgainst Abstain 1a. Amina Belouizdad 000 The Board of Directors recommends you vote FORproposals 2 and 3.ForAgainst Abstain 1b. Bjorn R. L. Hanson 000 2.Ratify the appointment of ERNST & YOUNG LLP as the Company's independent registered publicDecember 31, 2022. 000 executive compensation.1f. Jonathan P. Stanner000be brought before the Annual Meeting and at anyadjournments or postponements thereof.1g. Thomas W. Storey0001h. Hope S. Taitz000Please sign exactly as your name(s) appear(s) hereon. When signing as attorney, executor,administrator, or other fiduciary, please give full title as such. Joint owners should each sign0personally. All holders must sign. If a corporation or partnership, please sign in full corporate or partnership name by authorized officer.amortization) from our operating results.
65
![[MISSING IMAGE: tm2210311d1-px_02scanbw.jpg]](https://capedge.com/proxy/DEF 14A/0001104659-22-040182/tm2210311d1-px_02scanbw.jpg)
| 2023 | 2022 | 2021 | ||||||||||||||||||
| Net (loss) income | $ | (28,116) | $ | 1,217 | $ | (68,584) | ||||||||||||||
| Depreciation and amortization | 150,924 | 150,160 | 105,955 | |||||||||||||||||
| Interest expense | 86,798 | 65,581 | 43,368 | |||||||||||||||||
| Interest income | (568) | (65) | (8) | |||||||||||||||||
| Income tax expense | 2,798 | 3,611 | 1,473 | |||||||||||||||||
| EBITDA | 211,836 | 220,504 | 82,204 | |||||||||||||||||
| Loss on write-down of assets | 16,661 | 10,420 | 4,361 | |||||||||||||||||
| Loss (gain) on disposal of assets and other dispositions, net | 385 | (20,315) | (240) | |||||||||||||||||
EBITDAre | 228,882 | 210,609 | 86,325 | |||||||||||||||||
| Recoveries of credit losses | (1,230) | (1,100) | (2,632) | |||||||||||||||||
| Amortization of lease-related intangible assets | — | — | 87 | |||||||||||||||||
| Amortization of key money liabilities | (498) | (363) | — | |||||||||||||||||
Equity-based compensation(1) | 7,743 | 8,446 | 10,681 | |||||||||||||||||
Executive transition costs(2) | — | — | 1,065 | |||||||||||||||||
| Transaction costs | 13 | 749 | 3,849 | |||||||||||||||||
| Debt transaction costs | 461 | 1,528 | 220 | |||||||||||||||||
| Non-cash interest income | (531) | (113) | (1,042) | |||||||||||||||||
| Non-cash lease expense, net | 481 | 505 | 521 | |||||||||||||||||
| Casualty losses, net | 2,112 | 2,505 | 468 | |||||||||||||||||
| Loss (income) related to non-controlling interests in consolidated joint ventures | 14,824 | (2,321) | 2,896 | |||||||||||||||||
| Adjustments related to non-controlling interests in consolidated joint ventures | (62,681) | (39,213) | (11,943) | |||||||||||||||||
Special allocation related to sale of joint venture asset(3) | — | (417) | — | |||||||||||||||||
| Non-cash state taxes and other, net | 447 | — | — | |||||||||||||||||
Adjusted EBITDAre | $ | 190,023 | $ | 180,815 | $ | 90,495 | ||||||||||||||
(1) The Noticetotal equity-based compensation expense for the years ended December 31, 2022 and Proxy Statement2021 includes $1.3 million and Form 10-K$2.9 million of incremental expense related to the modification of certain restricted stock awards as a result of the departure of our Chief Operating Officer and Executive Chairman, respectively.
(2) Executive transition costs are available at www.proxyvote.comSUMMIT HOTEL PROPERTIES, INC.Annual Meetingcash payments to our former Executive Chairman as a result of Stockholders May 12, 20228:00 AM CENTRAL TIMEthe non-renewal of his employment contract in December 2021.
(3) During the year ended December 31, 2022, we earned a $0.4 million promote related to the sale by the GIC Joint Venture of the sale of a 169-guestroom Hilton Garden Inn San Francisco Airport North in San Francisco, CA for a gross selling price of $75.0 million. The stockholder (the "Stockholder")sale of this property resulted in a net gain of $20.5 million to the GIC Joint Venture. Our promote is earned when the internal rate of return to GIC related to capital transactions exceeds a specified investment hurdle rate. We have adjusted this amount from our calculation of AFFO because it relates to the gain on the sale of the property and not on-going operations.
66
Appendix A
SUMMIT HOTEL PROPERTIES, INC.
2024 EQUITY INCENTIVE PLAN
Effective
May 22, 2024
67
DEFINITIONS
1.01. Affiliate
Affiliate means any entity, whether now or hereafter existing, which controls, is controlled by, or is under common control with, the Company (including, but not limited to, joint ventures, limited liability companies and partnerships). For this purpose, the term “control” shall mean ownership of 50% or more of the total combined voting power or value of all classes of shares or interests in the entity, or the power to direct the management and policies of the entity, by contract or otherwise.
1.02. Agreement
Agreement means a written agreement (including any amendment or supplement thereto) between the Company and a Participant specifying the terms and conditions of an Award granted to such Participant.
1.03 Award
Award means any Option, SAR, Stock Award, Performance Unit award, Other Equity-Based Award or Incentive Award.
1.04. Board
Board means the Board of Directors of the Company.
1.05. Change in Control
“Change in Control” shall mean a change in control of the Company which will be deemed to have occurred after the date hereof if:
1.any “person” as such term is used in Section 3(a)(9) of the Exchange Act, as modified and used in Sections 13(d) and 14(d) thereof except that such term shall not include (A) the Company or any of its subsidiaries, (B) any trustee or other fiduciary holding securities under an employee benefit plan of the Company or any of its affiliates, (C) an underwriter temporarily holding securities pursuant to an offering of such securities, (D) any corporation owned, directly or indirectly, by the shareholders of the Company in substantially the same proportions as their ownership of the Company’s common stock, or (E) any person or group as used in Rule 13d-1(b) under the Exchange Act, is or becomes the Beneficial Owner, as such term is defined in Rule 13d-3 under the Exchange Act, directly or indirectly, of securities of the Company representing more than 50% of the combined voting power of outstanding Company securities;
2.during any period of two consecutive years, individuals who at the beginning of such period constitute the Board, and any new director (other than (A) a director designated by a person who has entered into an agreement with the Company to effect a transaction described in clause (1), (3), or (4) of this Section 1.05 or (B) a director whose initial assumption of office is in connection with an actual or threatened election contest, including but not limited to a consent solicitation, relating to the election of directors of the Company) whose election by the Board or
1
nomination for election by the Company’s shareholders was approved by a vote of at least two-thirds (2/3) of the directors then still in office who either were directors at the beginning of the period or whose election or nomination for election was previously so approved, cease for any reason to constitute at least a majority thereof;
3.there is consummated a merger or consolidation of the Company or any direct or indirect subsidiary of the Company with any other corporation, other than a merger or consolidation in which the holders of Company voting securities immediately before the merger or consolidation continue to own more than 50% of the combined voting power of the Company or the surviving entity in the merger or consolidation or any parent thereof outstanding immediately after such merger or consolidation; or
4.there is consummated an agreement for the sale or disposition by the Company of all or substantially all of the Company’s assets (or any transaction having a similar effect, including a liquidation) other than a sale or disposition by the Company of all or substantially all of the Company’s assets to an entity, more than fifty percent (50%) of the combined voting power and common stock of which is owned by shareholders of the Company in substantially the same proportions as their ownership of the common stock of the Company immediately prior to such sale.
If a change in control constitutes a payment event with respect to any Option, SAR, Stock Award, Performance Unit or Other Equity-Based Award that provides for the deferral of compensation and is subject to Section 409A of the Code, no payment will be made under that award on account of a Change in Control unless the event described in (1), (2), (3) or (4) above, as applicable, constitutes a “change in control event” under Treasury Regulation Section 1.409A-3(i)(5).
1.06. Code
Code means the Internal Revenue Code of 1986, and any amendments thereto.
1.07. Committee
Committee means the Compensation Committee of the Board. Unless otherwise determined by the Board, the Committee shall consist solely of two or more non-employee members of the Board, each of whom is intended to qualify as a “non-employee director” as defined by Rule 16b-3 of the Exchange Act or any successor rule and an “independent director” under the rules of any exchange or automated quotation system on which the Common Stock is listed, traded or quoted; provided , that any action taken by the Committee shall be valid and effective, whether or not the members of the Committee at the time of such action are later determined not to have satisfied the foregoing requirements or otherwise provided in any charter of the Committee. If there is no Compensation Committee, then “Committee” means the Board; and provided, further that with respect to awards made to a Non-Employee Director, “Committee” means the Board.
1.08. Common Stock
Common Stock means the common stock, par value $0.01 per share, of the Company.
1.09. Company
2
Company means Summit Hotel Properties, Inc., a Maryland corporation (the "Company"), hereby appoints Jonathan P. Stannercorporation.
1.10. Consultant
Consultant means any person or entity, including any advisor, engaged by the Company or any of its Affiliates (including the Operating Partnership) to render services to such entity that qualifies as a consultant or advisor under the applicable rules of Form S-8 Registration Statement.
1.11. Control Change Date
Control Change Date means the date on which a Change in Control occurs. If a Change in Control occurs on account of a series of transactions, the “Control Change Date” is the date of the last of such transactions.
1.12. Corresponding SAR
Corresponding SAR means an SAR that is granted in relation to a particular Option and Christopher R. Eng,that can be exercised only upon the surrender to the Company, unexercised, of that portion of the Option to which the SAR relates.
1.13. Dividend Equivalent Right
Dividend Equivalent Right means the right, subject to the terms and conditions prescribed by the Committee, of a Participant to receive (or have credited) cash, shares or eitherother property in amounts equivalent to the cash, shares or other property dividends declared on shares of them,Common Stock with respect to specified Performance Units or units denominated in shares of Common Stock or other Company securities subject to an Other Equity-Based Award, as proxies, eachdetermined by the Committee, in its sole discretion. Dividend Equivalent Rights payable on a Performance Unit award or units denominated in shares of Common Stock or other Company securities subject to an Other Equity-Based Award that does not become nonforfeitable solely on the basis of continued employment or service shall be accumulated and distributed, without interest, only when, and to the extent that, the underlying award is vested or earned. The Committee may provide that Dividend Equivalents (if any) shall be deemed to have been reinvested in additional shares of Common Stock or otherwise reinvested. For avoidance of doubt, Dividend Equivalent Rights may not be granted in connection with Options or SARs.
1.14. Effective Date
Effective Date means May 22, 2024.
1.15. Exchange Act
Exchange Act means the Securities Exchange Act of 1934, as amended.
1.16. Fair Market Value
3
Fair Market Value means, on any given date, the reported “closing” price of a share of Common Stock on the New York Stock Exchange for such date or, if there is no closing price for a share of Common Stock on the date in question, the closing price for a share of Common Stock on the last preceding date for which a quotation exists. If, on any given date, the Common Stock is not listed for trading on the New York Stock Exchange, then Fair Market Value shall be the “closing” price of a share of Common Stock on such other exchange on which the Common Stock is listed for trading for such date (or, if there is no closing price for a share of Common Stock on the date in question, the closing price for a share of Common Stock on the last preceding date for which such quotation exists) or, if the Common Stock is not listed on any exchange, the amount determined by the Committee using any reasonable method in good faith and in accordance with the powerregulations under Section 409A of the Code.
1.17. Incentive Award
Incentive Award means an award awarded under Article XI which, subject to appoint his substitute,the terms and conditions prescribed by the Committee, entitles the Participant to attendreceive a payment from the Annual MeetingCompany or an Affiliate.
1.18. Initial Value
Initial Value means, with respect to a Corresponding SAR, the option price per share of Stockholders (the "Annual Meeting")the related Option and, with respect to a SAR granted independently of an Option, the price per share of Common Stock as determined by the Committee on the date of grant; provided, however, that the price shall not be held at 8:00 AM, CENTRAL TIMEless than the Fair Market Value on May 12, 2022,the date of grant, except in the case of Substitute Awards. Except as provided in Article XII, without the approval of shareholders, (a) the Initial Value of an outstanding SAR may not be reduced (by amendment, cancellation and new grant or otherwise) and (b) no payment may be made to cancel an outstanding SAR if on the date of such amendment, cancellation, new grant or payment the Initial Value exceeds the Fair Market Value (i.e., no cash buyouts).
1.19. LTIP Unit
LTIP Unit means an “LTIP Unit” as defined in the Operating Partnership’s partnership agreement. An LTIP Unit granted under this Plan represents the right to receive the benefits, payments or other rights in respect of an LTIP Unit set forth in that partnership agreement, subject to the terms and conditions of the applicable Agreement and that partnership agreement.
1.20. Non-Employee Director
Non-Employee Director means a member of the Board who is not an employee of the Company or an Affiliate.
1.21. Operating Partnership
Operating Partnership means Summit Hotel OP, LP, a Delaware limited partnership.
4
1.22. Option
Option means a share option that entitles the holder to purchase from the Company a stated number of Common Stock at the Hampton Inn & Suites located at 200 San Jacinto Boulevard, Austin, Texas 78701,price set forth in an Agreement.
1.23. Other Equity-Based Award
Other Equity-Based Award means any award other than an Option, SAR, a Performance Unit award or a Stock Award which, subject to such terms and at any adjournmentsconditions as may be prescribed by the Committee, entitles a Participant to receive Common Stock or postponements thereof,rights or units valued in whole or in part by reference to, castor otherwise based on, behalfCommon Stock (including securities convertible into Common Stock) or other equity interests including LTIP Units.
1.24. Participant
Participant means a person and who satisfies the requirements of Article IV and is selected by the Committee to receive an Award.
1.25. Performance Goal
Performance Goal means a performance objective that may include, without limitation one or more of the Stockholder all the votes that the Stockholder is entitled to cast at the Annual Meetingfollowing, alone or in combination: (i) FFO or FFO per share; (ii) adjusted FFO or adjusted FFO per share; (iii) earnings before interest, taxes, depreciation and to otherwise represent the Stockholder at the Annual Meeting. The Stockholder hereby acknowledges receiptamortization (“EBITDA”); (iv) adjusted EBITDA; (v) hotel or property EBITDA; (vi) return on equity; (vii) return on capital or invested capital; (viii) total earnings; (ix) earnings per share; (x) earnings growth; (xi) Fair Market Value; (xii) volume weighted average Fair Market Value; (xiii) appreciation in Fair Market Value; (xiv) revenue per available room; (xv) total return or total shareholder return; (xvi) revenues; (xvii) cash flow or cash flow per share; (xviii) operating income; (xix) operating margins; (xx) gross or net profit, EBITDA or hotel EBITDA margins or any of the Noticeforegoing on an adjusted basis; (xxi) dividends paid or payable; (xxii) cash or funds available for distribution, including on an adjusted or on a per share basis; (xxiii) level of expenses, including capital expenses or corporate overhead expenses; (xxiv) acquisition or disposition metrics; (xxv) revenue per available room growth in same store hotels; or (xxvi) debt or equity related metrics. A Performance Goal or objective may be expressed with respect to the Company, one or more Affiliates, one or more business units or one or more properties. A Performance Goal or objective may be expressed on an absolute basis or relative to the performance of one or more similarly situated companies or a published index. When establishing Performance Goals and objectives, the Committee may exclude any or all special, unusual or extraordinary items as determined under U.S. generally accepted accounting principles, including without limitation, the charges or costs associated with restructurings of the Annual MeetingCompany, discontinued operations, other unusual or non-recurring items and the cumulative effects of accounting changes. The Committee may also adjust the accompanying Proxy Statement,Performance Goals and objectives as it deems equitable in recognition of unusual or non-recurring events affecting the Company, changes in applicable tax laws or accounting principles or such other factors as the Committee may determine.
5
1.26. Performance Units
Performance Units means an Award, in the amount determined by the Committee, stated with reference to a specified or determinable number of shares of Common Stock, that in accordance with the terms of an Agreement entitles the holder to receive a payment for each specified unit equal to the value of which are incorporated by reference,the Performance Unit on the date of payment.
1.27. Plan
Plan means this Summit Hotel Properties Inc. 2024 Equity Incentive Plan, as amended and revokes any proxy heretofore givenrestated herein.
1.28. Prior Plan
Prior Plan means the Summit Hotel Properties Inc. 2011 Equity Incentive Plan.
1.29. REIT
REIT means a real estate investment trust within the meaning of Sections 856 through 860 of the Code.
1.30. SAR
SAR means a share appreciation right that in accordance with the terms of an Agreement entitles the holder to receive, with respect to each share of Common Stock encompassed by the exercise of the SAR, the excess, if any, of the Fair Market Value at the time of exercise over the Initial Value. References to “SARs” include both Corresponding SARs and SARs granted independently of Options, unless the context requires otherwise.
1.31. Stock Award
Stock Award means Common Stock awarded to a Participant under Article VIII.
1.32. Substitute Awards
Substitute Awards means Awards granted or Shares issued by the Company in assumption of, or in substitution or exchange for: (i) awards previously granted by an entity (other than the Company or a Subsidiary) that is acquired by the Company or any subsidiary or with which the Company or any subsidiary combines; or (ii) the right or obligation of any entity acquired by the Company or acquired by any subsidiary, or with which the Company or any subsidiary combines, to make future awards.
1.33. Ten Percent Shareholder
Ten Percent Shareholder means any individual owning more than ten percent (10%) of the total combined voting power of all classes of stock of the Company or of a “parent corporation” or “subsidiary corporation” (as such meeting. This proxy,terms are defined in Section 424 of the Code) of the Company. An individual shall be considered to own any voting shares owned (directly or indirectly) by or for his or
6
her brothers, sisters, spouse, ancestors or lineal descendants and shall be considered to own proportionately any voting shares owned (directly or indirectly) by or for a corporation, partnership, estate or trust of which such individual is a shareholder, partner or beneficiary.
ARTICLE II
PURPOSES
The Plan is intended to assist the Company and its Affiliates in recruiting and retaining employees, directors and other service providers with ability and initiative by enabling such persons or entities to participate in the future success of the Company and its Affiliates and to associate their interests with those of the Company and its shareholders. The Plan is intended to permit the grant of both Options qualifying under Section 422 of the Code (“incentive stock options”) and Options not so qualifying, and the grant of SARs, Stock Awards, Performance Units, Other Equity-Based Awards and Incentive Awards in accordance with the Plan and any procedures that may be established by the Committee. No Option that is intended to be an incentive stock option shall be invalid for failure to qualify as an incentive stock option (and shall be considered a nonstatutory option in the event, and to the extent, of such failure). The proceeds received by the Company from the sale of Common Stock pursuant to this Plan shall be used for general corporate purposes.
ARTICLE III
ADMINISTRATION
The Plan shall be administered by the Committee. The Committee shall have authority to grant SARs, Stock Awards, Performance Units, Options, Other Equity-Based Awards and Incentive Awards upon such terms (not inconsistent with the provisions of this Plan), as the Committee may consider appropriate. Such terms may include, but are not limited to, conditions (in addition to those contained in this Plan), on the exercisability of all or any part of an Option or SAR or on the transferability or forfeitability of an Award. Notwithstanding any such conditions, the Committee may, in its discretion, accelerate the time at which any Option or SAR may be exercised, or the time at which a Stock Award or Other Equity-Based Award may become transferable or nonforfeitable or the time at which an Other Equity-Based Award, an award of Performance Units or an Incentive Award may be settled. In addition, the Committee shall have complete authority to interpret all provisions of this Plan; to prescribe the form of Agreements; to adopt, amend, and rescind rules and regulations pertaining to the administration of the Plan (including rules and regulations that require or allow Participants to defer the payment of benefits under the Plan); and to make all other determinations necessary or advisable for the administration of this Plan. The Committee’s determinations under the Plan (including without limitation, determinations of the individuals to receive awards under the Plan, the form, amount and timing of such awards, the terms and provisions of such awards and the Agreements) need not be uniform and may be made by the Committee selectively among individuals who receive, or are eligible to receive, awards under the Plan, whether or not such persons are similarly situated. The express grant in the Plan of any specific power to the Committee shall not be construed as limiting any power or authority of the Committee. Any decision made, or action taken, by the Committee in connection with the administration of this Plan shall be final and conclusive. The members of the Committee shall not be liable for any act done in good faith with respect to this Plan or any Agreement, Option, SAR, Stock Award, Other Equity-Based Award, Incentive Award or award of Performance Units. All expenses of administering this Plan shall be borne by the Company.
7
ARTICLE IV
ELIGIBILITY
Any employee of the Company or an Affiliate (including the Operating Partnership or a trade or business that becomes an Affiliate after the adoption of this Plan) and any member of the Board is eligible to participate in this Plan. In addition, any Consultant is eligible to participate in this Plan if the Committee, in its sole discretion, determines that the participation of such individual is in the best interest of the Company.
ARTICLE V
COMMON STOCK SUBJECT TO PLAN
5.01. Common Stock Issued
Upon the award of Common Stock pursuant to a Stock Award, or in settlement of an Other Equity-Based Award or in settlement of an Incentive Award or an award of Performance Units, the Company may deliver to the Participant shares of Common Stock from its treasury shares or authorized but unissued Common Stock. Upon the exercise of any Option, SAR or Other Equity-Based Award denominated in Common Stock, the Company may deliver to the Participant (or the Participant’s broker if the Participant so directs), shares of Common Stock from its treasury shares or authorized but unissued Common Stock.
5.02. Aggregate Limit
(a) Subject to adjustments as provided in Article XII and the share counting provisions in Section 5.03, as of the Effective Date, an aggregate of 4,406,174[1] shares of Common Stock may be issued pursuant to Awards granted under the Plan, less one (1) share for every one (1) share subject to an award granted under the Prior Plan after March 29, 2024 and prior to the Effective Date. Other Equity-Based Awards granted on and after the Effective Date that are LTIP Units shall reduce the such share reserve on a one-for-one basis, i.e., each such unit shall be treated as an award of Common Stock. From and after the Effective Date no new awards shall be granted under the Prior Plan.
(b) The maximum number of shares of Common Stock that may be covered by incentive stock options or Corresponding SARs that are related to incentive stock options shall not exceed 4,406,174 shares, subject to adjustment as provided in Article XII.
[1] The 4,406,174 shares reflect 1,271,174 shares that remained available for grant under the Prior Plan as of March 29, 2024, plus 3,135,000 newly authorized shares approved by the Company’s stockholders on the Effective Date.
8
5.03. Reallocation of Shares
If any Award or grant under the Plan (including LTIP Units) or, after March 29, 2024, any award previously granted under the Prior Plan expires, is forfeited or is terminated without having been exercised or is paid in cash without delivery of Common Stock, then any shares of Common Stock covered by such lapsed, cancelled, expired, unexercised or cash-settled portion of such Award (or, after March 29, 2024, award previously granted under the Prior Plan) or grant and any forfeited, lapsed, cancelled or expired LTIP Units shall be recredited (or newly credited, as applicable) to this Plan’s reserve and may again be used for new Awards under this Plan. Any shares of Common Stock tendered or withheld to satisfy the grant or exercise price or tax withholding obligation pursuant to any Option or SAR (or, after March 29, an option or SAR previously granted under the Prior Plan) shall not be recredited to this Plan’s reserve and may not again be used for new Awards under this Plan. Any shares of Common Stock tendered or withheld to satisfy tax withholding obligations pursuant to any Stock Award, Performance Unit award, Other Equity-Based Award or Incentive Award (or, after March 29, 2024, stock award, performance unit award, other equity-based award or incentive award previously granted under the Prior Plan) shall be recredited (or newly credited, as applicable) to this Plan’s reserve and may again be used for new Awards under this Plan. In addition, the following shares may not again be made available for future grants or Awards under the Plan: (i) shares not issued or delivered as a result of the net settlement of an outstanding SAR or Option (or, after March 29, 2024, an option or SAR previously granted under the Prior Plan) or (ii) shares repurchased on the open market with the proceeds of an Option (or, after March 29, 2024, an option previously granted under the Prior Plan) exercise price. To the extent permitted by applicable law or the rules of any exchange on which the shares of Common Stock are listed for trading, Substitute Awards shall not reduce the number of shares of Common Stock available for issuance under the Plan.
5.04. Director Compensation Limitation
The sum of any cash compensation, or other compensation, and the value (determined as of the grant date) of Awards granted to a Non-Employee Director, in each case, as compensation for services as a Non-Employee Director during any fiscal year of the Company may not exceed $750,000 (with any compensation that is deferred counting towards this limit for the year in which the compensation is first earned, and not a later year of settlement). .
ARTICLE VI
OPTIONS
6.01. Award
In accordance with the provisions of Article IV, the Committee will designate each individual to whom an Option is to be granted and will specify the number of shares of Common Stock covered by such awards.
6.02. Option Price
The price per share of Common Stock purchased on the exercise of an Option shall be determined by the Committee on the date of grant but shall not be less than the Fair Market Value on the
9
date the Option is granted. Notwithstanding the preceding sentence, the price per share of Common Stock purchased on the exercise of any Option that is an incentive stock option granted to an individual who is a Ten Percent Shareholder on the date such option is granted, shall not be less than one hundred ten percent (110%) of the Fair Market Value on the date the Option is granted.
Maximum Option Period
The maximum period in which an Option may be exercised shall be determined by the Committee on the date of grant except that no Option shall be exercisable after the expiration of ten years from the date such Option was granted. In the case of an incentive stock option granted to a Participant who is a Ten Percent Shareholder on the date of grant, such Option shall not be exercisable after the expiration of five years from the date of grant. The terms of any Option may provide that it is exercisable for a period less than such maximum period.
6.03. Nontransferability
Except as provided in Section 6.05, each Option granted under this Plan shall be nontransferable except by will or by the laws of descent and distribution. In the event of any transfer of an Option (by the Participant or his transferee), the Option and any Corresponding SAR that relates to such Option must be transferred to the same person or persons or entity or entities. Except as provided in Section 6.05, during the lifetime of the Participant to whom the Option is granted, the Option may be exercised only by the Participant. No right or interest of a Participant in any Option shall be liable for, or subject to, any lien, obligation, or liability of such Participant.
6.04. Transferable Options
Section 6.04 to the contrary notwithstanding, if the Agreement provides, an Option that is not an incentive stock option may be transferred by a Participant to the Participant’s children, grandchildren, spouse, one or more trusts for the benefit of such family members or a partnership in which such family members are the only partners, on such terms and conditions as may be permitted under Rule 16b-3 under the Exchange Act as in effect from time to time. The holder of an Option transferred pursuant to this Section shall be bound by the same terms and conditions that governed the Option during the period that it was held by the Participant; provided, however, that such transferee may not transfer the Option except by will or the laws of descent and distribution. In the event of any transfer of an Option (by the Participant or his transferee), the Option and any Corresponding SAR that relates to such Option must be transferred to the same person or persons or entity or entities. Notwithstanding the foregoing, an Option may not be transferred for consideration absent shareholder approval.
6.05. Employee Status
For purposes of determining the applicability of Section 422 of the Code (relating to incentive stock options), or in the event that the terms of any Option provide that it may be exercised only during employment or continued service or within a specified period of time after termination of employment or continued service, the Committee may decide to what extent leaves of absence for governmental or military service, illness, temporary disability, or other reasons shall not be deemed interruptions of continuous employment or service.
10
6.06. Exercise
Subject to the provisions of this Plan and the applicable Agreement, an Option may be exercised in whole at any time or in part from time to time at such times and in compliance with such requirements as the Committee shall determine; provided, however, that incentive stock options (granted under the Plan and all plans of the Company and its Affiliates) may not be first exercisable in a calendar year for shares of Common Stock having a Fair Market Value (determined as of the date an Option is granted) exceeding $100,000. An Option granted under this Plan may be exercised with respect to any number of whole shares less than the full number for which the Option could be exercised. A partial exercise of an Option shall not affect the right to exercise the Option from time to time in accordance with this Plan and the applicable Agreement with respect to the remaining shares subject to the Option. The exercise of an Option shall result in the termination of any Corresponding SAR to the extent of the number of shares with respect to which the Option is exercised.
6.07. Payment
Subject to rules established by the Committee and unless otherwise provided in an Agreement, payment of all or part of the Option price may be made in cash, certified check, by tendering shares of Common Stock (or by attestation of ownership of Common Stock), by a broker-assisted cashless exercise or in such other form or manner acceptable to the Committee. If shares of Common Stock are used to pay all or part of the Option price, the sum of the cash and cash equivalent and the date of exercise Fair Market Value of the shares surrendered must not be less than the Option price of the shares for which the Option is being exercised.
6.08. Shareholder Rights
No Participant shall have any rights as a shareholder with respect to the shares of Common Stock subject to an Option until the date of exercise of such Option. Dividend Equivalent Rights are prohibited in conjunction with Options.
6.09. Disposition of Shares
A Participant shall notify the Company of any sale or other disposition of shares of Common Stock acquired pursuant to an Option that was an incentive stock option if such sale or disposition occurs (i) within two years of the grant of an Option or (ii) within one year of the issuance of the shares of Common Stock to the Participant. Such notice shall be in writing and directed to the Secretary of the Company.
ARTICLE VII
SARS
7.01. Award
In accordance with the provisions of Article IV, the Committee will designate each individual to whom SARs are to be granted and will specify the number of shares of Common Stock covered by such awards. No Participant may be granted Corresponding SARs (under the Plan and all plans of the Company and its Affiliates) that are related to incentive stock options which are first exercisable in any
11
calendar year for shares of Common Stock having an aggregate Fair Market Value (determined as of the date the related Option is granted) that exceeds $100,000.
7.02. Maximum SAR Period
The term of each SAR shall be determined by the Committee on the date of grant, except that no SAR shall have a term of more than ten years from the date of grant. In the case of a Corresponding SAR that is related to an incentive stock option granted to a Participant who is a Ten Percent Shareholder on the date of grant, such Corresponding SAR shall not be exercisable after the expiration of five years from the date of grant. The terms of any SAR may provide that it has a term that is less than such maximum period.
7.03. Nontransferability
Except as provided in Section 7.04, each SAR granted under this Plan shall be nontransferable except by will or by the laws of descent and distribution. In the event of any such transfer, a Corresponding SAR and the related Option must be transferred to the same person or persons or entity or entities. Except as provided in Section 7.04, during the lifetime of the Participant to whom the SAR is granted, the SAR may be exercised only by the Participant. No right or interest of a Participant in any SAR shall be liable for, or subject to, any lien, obligation, or liability of such Participant.
7.04. Transferable SARs
Section 7.03 to the contrary notwithstanding, if the Agreement provides, an SAR, other than a Corresponding SAR that is related to an incentive stock option, may be transferred by a Participant to the Participant’s children, grandchildren, spouse, one or more trusts for the benefit of such family members or a partnership in which such family members are the only partners, on such terms and conditions as may be permitted under Rule 16b-3 under the Exchange Act as in effect from time to time. The holder of an SAR transferred pursuant to this Section shall be bound by the same terms and conditions that governed the SAR during the period that it was held by the Participant; provided, however, that such transferee may not transfer the SAR except by will or the laws of descent and distribution. In the event of any transfer of a Corresponding SAR (by the Participant or his transferee), the Corresponding SAR and the related Option must be transferred to the same person or person or entity or entities. Notwithstanding the foregoing, in no event may an SAR be transferred for consideration absent shareholder approval.
7.05. Exercise
Subject to the provisions of this Plan and the applicable Agreement, an SAR may be exercised in whole at any time or in part from time to time at such times and in compliance with such requirements as the Committee shall determine; provided, however, that a Corresponding SAR that is related to an incentive stock option may be exercised only to the extent that the related Option is exercisable and only when properly executed,the Fair Market Value exceeds the option price of the related Option. An SAR granted under this Plan may be exercised with respect to any number of whole shares less than the full number for which the SAR could be exercised. A partial exercise of an SAR shall not affect the right to exercise the SAR from time to time in accordance with this Plan and the applicable Agreement with respect to the remaining shares subject to the SAR. The exercise of a Corresponding SAR shall result in the
12
termination of the related Option to the extent of the number of shares with respect to which the SAR is exercised.
7.06. Employee Status
If the terms of any SAR provide that it may be exercised only during employment or continued service or within a specified period of time after termination of employment or continued service, the Committee may decide to what extent leaves of absence for governmental or military service, illness, temporary disability or other reasons shall not be deemed interruptions of continuous employment or service.
7.07. Settlement
At the Committee’s discretion, the amount payable as a result of the exercise of an SAR may be settled in cash, shares of Common Stock, or a combination of cash and Common Stock. No fractional share will be voteddeliverable upon the exercise of a SAR but a cash payment will be made in lieu thereof.
Shareholder Rights
No Participant shall, as a result of receiving an SAR, have any rights as a shareholder of the Company or any Affiliate until the date that the SAR is exercised and then only to the extent that the SAR is settled by the issuance of shares of Common Stock. Dividend Equivalent Rights are prohibited in conjunction with SARs.
ARTICLE VIII
STOCK AWARDS
8.01. Award
In accordance with the provisions of Article IV, the Committee will designate each individual to whom a Stock Award is to be made and will specify the number of shares of Common Stock covered by such awards.
8.02. Vesting
The Committee, on the date of the award, shall prescribe that a Participant’s rights in a Stock Award shall be forfeitable or otherwise restricted for a period of time or subject to such conditions as may be set forth in the manner directed herein. IfAgreement. By way of example and not of limitation, the Committee may prescribe that a Participant’s rights in a Stock Award shall be forfeitable or otherwise restricted subject to the attainment of performance objectives, including objectives stated with reference to one or more Performance Goals.
8.03. Employee Status
In the event that the terms of any Stock Award provide that shares may become transferable and nonforfeitable thereunder only after completion of a specified period of employment or continuous service, the Committee may decide in each case to what extent leaves of absence for governmental or
13
military service, illness, temporary disability, or other reasons shall not be deemed interruptions of continuous employment or service.
8.04. Shareholder Rights
Unless otherwise specified in accordance with the applicable Agreement, while the shares of Common Stock granted pursuant to the Stock Award may be forfeited or are nontransferable, a Participant will have all rights of a stockholder with respect to a Stock Award, including the right to receive dividends and vote the shares; provided, however, if the Stock Award does not vest solely on account of continued employment or service, any dividends payable on the shares will be accumulated and paid to the participant when, and only to the extent that, the underlying Stock Award is earned and becomes vested. During such period (i) a Participant may not sell, transfer, pledge, exchange, hypothecate, or otherwise dispose of shares granted pursuant to a Stock Award, (ii) the Company shall retain custody of the certificates evidencing shares granted pursuant to a Stock Award, if any, and (iii) the Participant will deliver to the Company a stock power, endorsed in blank, with respect to each Stock Award, as applicable. The limitations set forth in the preceding sentence shall not apply after the shares granted under the Stock Award are transferable and are no longer forfeitable.
ARTICLE IX
PERFORMANCE UNIT AWARDS
9.01. Award
In accordance with the provisions of Article IV, the Committee will designate each individual to whom an award of Performance Units is to be made and will specify the number of shares of Common Stock covered by such directionawards. The Committee also will specify whether Dividend Equivalent Rights are granted in conjunction with the Performance Units.
9.02. Earning the Award
The Committee, on the date of the grant of an award, shall prescribe that the Performance Units will be earned, and the Participant will be entitled to receive payment pursuant to the award of Performance Units, only upon the satisfaction of performance objectives, including objectives stated with reference to one or more Performance Goals or such other criteria as may be prescribed by the Committee.
9.03. Payment
In the discretion of the Committee, the amount payable when an award of Performance Units is earned may be settled in cash, by the issuance of shares of Common Stock or a combination thereof. A fractional share of Common Stock shall not be deliverable when an award of Performance Units is earned, but a cash payment will be made in lieu thereof. The amount payable when an award of Performance Units is earned shall be paid in a lump sum.
14
9.04. Shareholder Rights
A Participant, as a result of receiving an award of Performance Units, shall not have any rights as a shareholder until, and then only to the extent that, the award of Performance Units is earned and settled in Common Stock. After an award of Performance Units is earned and settled in shares of Common Stock, a Participant will have all the rights of a shareholder as described in Section 8.05.
9.05. Nontransferability
Except as provided in Section 9.06, Performance Units granted under this Plan shall be nontransferable except by will or by the laws of descent and distribution. No right or interest of a Participant in any Performance Units shall be liable for, or subject to, any lien, obligation, or liability of such Participant.
9.06. Transferable Performance Units
Section 9.05 to the contrary notwithstanding, if the Agreement provides, an award of Performance Units may be transferred by a Participant to the Participant’s children, grandchildren, spouse, one or more trusts for the benefit of such family members or a partnership in which such family members are the only partners, on such terms and conditions as may be permitted under Rule 16b-3 under the Exchange Act as in effect from time to time. The holder of Performance Units transferred pursuant to this Section shall be bound by the same terms and conditions that governed the Performance Units during the period that they were held by the Participant; provided, however that such transferee may not transfer Performance Units except by will or the laws of descent and distribution. Notwithstanding the foregoing, in no event may a Performance Unit be transferred for consideration absent shareholder approval.
9.07. Employee Status
In the event that the terms of any Performance Unit award provide that no payment will be made unless the Participant completes a stated period of employment or continued service, the Committee may decide to what extent leaves of absence for government or military service, illness, temporary disability, or other reasons shall not be deemed interruptions of continuous employment or service.
ARTICLE X
OTHER EQUITY–BASED AWARDS
10.01. Award
In accordance with the provisions of Article IV, the Committee will designate each individual to whom an Other Equity-Based Award is to be made and will specify the number of shares of Common Stock or other equity interests (including LTIP Units) covered by such awards; provided, however, that the grant of LTIP Units must satisfy the requirements of the partnership agreement of the Operating Partnership as in effect on the date of grant. The Committee also will specify whether Dividend Equivalent Rights are granted in conjunction with the Other Equity-Based Award.
15
10.02. Terms and Conditions
The Committee, at the time an Other Equity-Based Award is made, shall specify the terms and conditions which govern the award. The terms and conditions of an Other Equity-Based Award may prescribe that a Participant’s rights in the Other Equity-Based Award shall be forfeitable, nontransferable or otherwise restricted for a period of time or subject to such other conditions as may be determined by the Committee, in its discretion and set forth in the Agreement. By way of example and not of limitation, the Committee may prescribe that a Participant’s rights in an Other Equity-Based Award shall be forfeitable or otherwise restricted subject to the attainment of performance objectives, including objectives stated with reference to one or more Performance Goals. Other Equity-Based Awards may be granted to Participants, either alone or in addition to other awards granted under the Plan, and Other Equity-Based Awards may be granted in the settlement of other Awards granted under the Plan.
10.03. Payment or Settlement
Other Equity-Based Awards valued in whole or in part by reference to, or otherwise based on, shares of Common Stock, shall be payable or settled in Common Stock, cash or a combination of Common Stock and cash, as determined by the Committee in its discretion; provided, however, that any shares of Common Stock that are issued on account of the conversion of LTIP Units into Common Stock shall not be issued under the Plan and shall not reduce the number of shares of Common Stock available for issuance under the Plan. Other Equity-Based Awards denominated as equity interests other than shares of Common Stock may be paid or settled in shares or units of such equity interests or cash or a combination of both as determined by the Committee in its discretion.
10.04. Employee Status
If the terms of any Other Equity-Based Award provides that it may be earned or exercised only during employment or continued service or within a specified period of time after termination of employment or continued service, the Committee may decide to what extent leaves of absence for governmental or military service, illness, temporary disability or other reasons shall not be deemed interruptions of continuous employment or service.
10.05. Shareholder Rights
A Participant, as a result of receiving an Other Equity-Based Award, shall not have any rights as a shareholder until, and then only to the extent that, the Other Equity-Based Award is earned and settled in shares of Common Stock.
ARTICLE XI
INCENTIVE AWARDS
11.01. Award
In accordance with the provisions of Article IV, the Committee will designate each individual to whom an Incentive Award is to be made.
16
11.02. Terms and Conditions
The Committee, at the time an Incentive Award is made, shall specify the terms and conditions that govern the award.
11.03. Nontransferability
Incentive Awards granted under this proxyPlan shall be nontransferable except by will or by the laws of descent and distribution. No right or interest of a Participant in an Incentive Award shall be liable for, or subject to, any lien, obligation, or liability of such Participant.
11.04. Employee Status
If the terms of an Incentive Award provide that a payment will be votedmade thereunder only if the Participant completes a stated period of employment or continued service the Committee may decide to what extent leaves of absence for governmental or military service, illness, temporary disability or other reasons shall not be deemed interruptions of continuous employment or service.
11.05. Settlement
An Incentive Award that is earned shall be settled with a single lump sum payment which may be in accordancewithcash, Common Stock or a combination of cash and Common Stock, as determined by the Committee.
11.06. Shareholder Rights
No Participant shall, as a result of receiving an Incentive Award, have any rights as a shareholder of the Company or an Affiliate until the date that the Incentive Award is settled and then only to the extent that the Incentive Award is settled by the issuance of shares of Common Stock.
ARTICLE XII
ADJUSTMENT UPON CHANGE IN COMMON STOCK
The maximum number and type of shares of Common Stock as to which Options, SARs, Performance Units, Stock Awards, Incentive Awards and Other Equity-Based Awards may be granted and the terms of outstanding Stock Awards, Options, SARs, Performance Units, Incentive Awards and Other Equity-Based Awards (including the number and type of securities underlying such Awards) shall be adjusted as the Board determines is equitably required in the event that (i) the Company (a) effects one or more nonreciprocal transactions between the Company and its shareholders such as a stock dividend, extra-ordinary cash dividend, stock split, subdivision or consolidation of Directors' recommendations. shares that affects the number or kind of shares of Common Stock (or other securities of the Company) or the Fair Market Value (or the value of other Company securities) and causes a change in the Fair Market Value of the Common Stock subject to outstanding awards or (b) engages in a transaction to which Section 424 of the Code applies or (ii) there occurs any other event which, in the judgment of the Board necessitates such action. Any determination made under this Article XII by the Board shall be nondiscretionary, final and conclusive.
17
The votes entitledissuance by the Company of shares of any class, or securities convertible into shares of any class, for cash or property, or for labor or services, either upon direct sale or upon the exercise of rights or warrants to subscribe therefor, or upon conversion of shares or obligations of the Company convertible into such shares or other securities, shall not, alone, affect, and no adjustment by reason thereof shall be made with respect to, the maximum number of shares as to which Options, SARs, Performance Units, Stock Awards, Incentive Awards and Other Equity-Based Awards may be granted, or the terms of outstanding Stock Awards, Options, SARs, Performance Shares or Other Equity-Based Awards.
The Committee may make Stock Awards and may grant Options, SARs, Performance Units, Incentive Awards or Other Equity-Based Awards in substitution for performance shares, phantom shares, stock awards, stock options, stock appreciation rights, or similar awards held by an individual who becomes an employee of the Company or an Affiliate in connection with a transaction described in the first paragraph of this Article XII. Notwithstanding any provision of the Plan, the terms of such substituted Stock Awards, SARs, Other Equity-Based Awards, Options, Incentive Awards or Performance Units shall be as the Committee, in its discretion, determines is appropriate.
ARTICLE XIII
COMPLIANCE WITH LAW AND APPROVAL OF REGULATORY BODIES
No Option or SAR shall be exercisable, no shares of Common Stock shall be issued, no certificates for shares of Common Stock shall be delivered, no book entries evidencing shares of Common Stock shall be made and no payment shall be made under this Plan except in compliance with all applicable federal and state laws and regulations (including, without limitation, withholding tax requirements), any listing agreement to which the Company is a party, and the rules of all domestic stock exchanges on which the Company’s shares may be listed. The Company shall have the right to rely on an opinion of its counsel as to such compliance. Any certificate issued to evidence shares of Common Stock when a Stock Award is granted, a Performance Unit, Incentive Award or Other Equity-Based Award is settled or for which an Option or SAR is exercised may bear such legends and statements as the Committee may deem advisable to assure compliance with federal and state laws and regulations. No Option or SAR shall be exercisable, no Stock Award or Performance Unit shall be granted, no shares of Common Stock shall be issued, no certificate for shares of Common Stock shall be delivered, no book entries evidencing shares of Common Stock shall be made and no payment shall be made under this Plan until the Company has obtained such consent or approval as the Committee may deem advisable from regulatory bodies having jurisdiction over such matters.
ARTICLE XIV
GENERAL PROVISIONS
14.01. Effect on Employment and Service
Neither the adoption of this Plan, its operation, nor any documents describing or referring to this Plan (or any part thereof), shall confer upon any individual or entity any right to continue in the employ or service of the Company or an Affiliate or in any way affect any right and power of the Company or an Affiliate to terminate the employment or service of any individual or entity at any time with or without assigning a reason therefor.
18
14.02. Unfunded Plan
This Plan, insofar as it provides for grants, shall be unfunded, and the Company shall not be required to segregate any assets that may at any time be represented by grants under this Plan. Any liability of the Company to any person with respect to any grant under this Plan shall be based solely upon any contractual obligations that may be created pursuant to this Plan. No such obligation of the Company shall be deemed to be castsecured by any pledge of, or other encumbrance on, any property of the Company.
14.03. Rules of Construction
Headings are given to the articles and sections of this Plan solely as a convenience to facilitate reference. The reference to any statute, regulation, or other provision of law shall be construed to refer to any amendment to or successor of such provision of law.
14.04. Withholding Taxes
Each Participant shall be responsible for satisfying any income and employment tax withholding obligations attributable to participation in the Plan. Unless otherwise provided by the Stockholder willAgreement, any such withholding tax obligations may be castsatisfied in cash (including from any cash payable in settlement of an award of Performance Units, SARs, Incentive Awards or Other Equity-Based Award) or a cash equivalent acceptable to the Committee. Any statutory federal, state, district or city withholding tax obligations also may be satisfied (a) by surrendering to the Company shares of Common Stock previously acquired by the Participant; (b) by authorizing the Company to withhold or reduce the number of shares of Common Stock otherwise issuable to the Participant upon the exercise of an Option or SAR, the settlement of a Performance Unit award, Incentive Award or an Other Equity-Based Award (if applicable) or the grant or vesting of a Stock Award; or (c) by any other method as may be approved by the Committee. If shares of Common Stock are used to pay all or part of such withholding tax obligation, the Fair Market Value of the shares surrendered, withheld or reduced shall be determined as of the day the tax liability arises and the number of shares of Common Stock which may be withheld or surrendered shall be limited to the number of shares which have a Fair Market Value on the day preceding the date of withholding equal to the aggregate amount of such liabilities based on the minimum statutory withholding rates for federal, state, local and foreign income tax and payroll tax purposes that are applicable to such supplemental taxable income or such other higher rates approved by the Committee (which rates shall in no event exceed the maximum individual statutory tax rate in the applicable jurisdiction at the time of such withholding (or such other rate as may be required to avoid the liability classification of the applicable award under generally accepted accounting principles in the United States of America)).
19
14.05. REIT Status
The Plan shall be interpreted and construed in a manner consistent with the Company’s status as a REIT. No award shall be granted or awarded, and with respect to any award granted under the Plan, such award shall not vest, be exercisable or be settled (i) to the extent that the grant, vesting, exercise or settlement could cause the Participant or any other person to be in violation of the common stock ownership limit or aggregate stock ownership limit prescribed by the Company’s Articles of Incorporation or Charter, as amended from time to time) or (ii) if, in the discretion of the proxy holder onCommittee, the grant, vesting, exercise or settlement of the award could impair the Company’s status as a REIT.
14.06. Elections Under Section 83(b)
No Participant may make and election under Section 83(b) of the Code with respect to the grant of any Award, the vesting of any Award, the settlement of any Award or the issuance of Common Stock under the Plan without the consent of the Company, which the Company may grant or withhold in its sole discretion.
14.07. Clawback Provisions
All Awards (including, without limitation, any proceeds, gains or other economic benefit actually or constructively received by Participant upon any receipt or exercise of any Award or upon the receipt or resale of any shares of Common Stock underlying the Award) shall be subject to reduction, cancellation, forfeiture and/or recoupment in accordance with the Company’s Policy for Recovery of Erroneously Awarded Compensation (as may be amended from time to time), and any other matterCompany clawback, recoupment, forfeiture or similar policies or provisions applicable to a Participant or required under applicable law, notwithstanding any other agreement to the contrary.
ARTICLE XV
CHANGE IN CONTROL
15.01. Impact of Change in Control.
If an Award is not assumed or replaced with a substitute award in accordance with Section 15.02, upon a Change in Control, the Committee is authorized to cause (i) outstanding Options and SARs to become fully exercisable, (ii) outstanding Stock Awards to become transferable and nonforfeitable and (iii) outstanding Performance Units, Incentive Awards and Other Equity-Based Awards to become earned and nonforfeitable in their entirety.
15.02. Assumption Upon Change in Control.
In the event of a Change in Control, the Committee, in its discretion and without the need for a Participant’s consent, may provide that an outstanding Option, SAR, Stock Award, Performance Unit, Incentive Award or Other Equity-Based Award shall be assumed by, or a substitute award granted by, the surviving entity in the Change in Control. Such assumed or substituted award shall be of the same type of award as the original Option, SAR, Stock Award, Performance Unit, Incentive Award or Other Equity-Based Award being assumed or substituted. The assumed or substituted award shall have a value, as of the Control Change Date, that is substantially equal to the value of the original Award (or
20
the difference between the Fair Market Value and the option price or Initial Value in the case of Options and SARs) as the Committee determines is equitably required and such other terms and conditions as may be prescribed by the Committee.
15.03. Cash-Out Upon Change in Control.
If an Award is not assumed or replaced with a substitute award in accordance with Section 15.02, upon a Change in Control, the Committee, in its discretion and without the need of a Participant’s consent, may provide that each Option, SAR, Stock Award, Performance Unit, Incentive Award and Other Equity-Based Award shall be cancelled in exchange for a payment. The payment may be in cash, shares of Common Stock or other securities or consideration received by shareholders in the Change in Control transaction or, in the case of an Incentive Award, the entire amount that can be paid under the Award (and, if the amount payable in settlement of an Incentive Award is based on the value of Common Stock, that value shall be the price per share received by shareholders for each share of Common Stock in the Change in Control transaction). Except as provided in the preceding sentence with respect to Incentive Awards, the amount of the payment shall be an amount that is substantially equal to (i) the amount by which the price per share received by shareholders in the Change in Control exceeds the option price or Initial Value in the case of an Option and SAR, or (ii) the price per share received by shareholders for each share of Common Stock subject to a Stock Award, Performance Unit or Other Equity-Based Award or (iii) the value of the other securities or property in which the Performance Unit or Other Equity-Based award is denominated. If the option price or Initial Value exceeds the price per share received by shareholders in the Change in Control transaction, the Option or SAR may be cancelled under this Section 15.03 without any payment to the Participant.
15.04. Limitation of Benefits
The benefits that a Participant may be entitled to receive under this Plan and other benefits that a Participant is entitled to receive under other plans, agreements and arrangements (which, together with the benefits provided under this Plan, are referred to as “Payments”), may constitute Parachute Payments (as hereinafter defined), that are subject to Code Sections 280G and 4999. As provided in this Section 15.04, the Parachute Payments will be reduced pursuant to this Section 15.04 if, and only to the extent that, a reduction will allow a Participant to receive a greater Net After Tax Amount (as hereinafter defined), than a Participant would receive absent a reduction.
The Accounting Firm (as hereinafter defined) will first determine the amount of any Parachute Payments that are payable to a Participant. The Accounting Firm also will determine the Net After Tax Amount attributable to the Participant’s total Parachute Payments.
The Accounting Firm will next determine the largest amount of Payments that may properly comebe made to the Participant without subjecting the Participant to tax under Code Section 4999 (the “Capped Payments”). Thereafter, the Accounting Firm will determine the Net After Tax Amount attributable to the Capped Payments.
The Participant will receive the total Parachute Payments or the Capped Payments, whichever provides the Participant with the higher Net After Tax Amount. If the Participant will receive the Capped Payments, the total Parachute Payments will be adjusted by first reducing the amount of any benefits under this Plan or any other plan, agreement or arrangement that are not subject to Section
21
409A of the Code (with the source of the reduction to be directed by the Participant) and then by reducing the amount of any benefits under this Plan or any other plan, agreement or arrangement that are subject to Section 409A of the Code (with the source of the reduction to be directed by the Participant) in a manner that results in the best economic benefit to the Participant (or, to the extent economically equivalent, in a pro rata manner). The Accounting Firm will notify the Participant and the Company if it determines that the Parachute Payments must be reduced to the Capped Payments and will send the Participant and the Company a copy of its detailed calculations supporting that determination.
As a result of the uncertainty in the application of Code Sections 280G and 4999 at the time that the Accounting Firm makes its determinations under this Section 15.04, it is possible that amounts will have been paid or distributed to the Participant that should not have been paid or distributed under this Section 15.04 (“Overpayments”), or that additional amounts should be paid or distributed to the Participant under this Section 15.04 (“Underpayments”). If the Accounting Firm determines, based on either the assertion of a deficiency by the Internal Revenue Service against the Company or the Participant, which assertion the Accounting Firm believes has a high probability of success or controlling precedent or substantial authority, that an Overpayment has been made, the Participant must repay such amount to the Company, without interest; provided, however, that no loan will be deemed to have been made and no amount will be payable by the Participant to the Company unless, and then only to the extent that, the deemed loan and payment would either reduce the amount on which the Participant is subject to tax under Code Section 4999 or generate a refund of tax imposed under Code Section 4999. If the Accounting Firm determines, based upon controlling precedent or substantial authority, that an Underpayment has occurred, the Accounting Firm will notify the Participant and the Company of that determination, and the amount of that Underpayment will be paid to the Participant promptly by the Company.
For purposes of this Section 15.04, the term “Accounting Firm” means the independent accounting firm engaged by the Company immediately before the Annual MeetingControl Change Date. For purposes of this Section 15.04, the term “Net After Tax Amount” means the amount of any Parachute Payments or Capped Payments, as applicable, net of taxes imposed under Code Sections 1, 3101(b) and 4999 and any adjournmentState or postponement thereof.Continuedlocal income taxes applicable to the Participant on the date of payment. The determination of the Net After Tax Amount shall be made using the highest combined effective rate imposed by the foregoing taxes on income of the same character as the Parachute Payments or Capped Payments, as applicable, in effect on the date of payment. For purposes of this Section 15.04, the term “Parachute Payment” means a payment that is described in Code Section 280G(b)(2), determined in accordance with Code Section 280G and the regulations promulgated or proposed thereunder.
Nothing in this Section 15.04 shall limit or otherwise supersede the provisions of any other agreement or plan which provides that a Participant cannot receive Payments in excess of the Capped Payments.
22
ARTICLE XVI
AMENDMENT
The Board may amend or terminate this Plan from time to time; provided, however, that no amendment may become effective until shareholder approval is obtained if (i) the amendment materially increases the aggregate number of shares of Common Stock that may be issued under the Plan (other than an adjustment pursuant to Article XII), or (ii) the amendment is required to be signedapproved by shareholders by the requirements of applicable law or under the New York Stock Exchange’s shareholder approval rules. For the avoidance of doubt, the Board may not (except pursuant to Article XII) without the approval of shareholders (a) reduce the option price per share of an outstanding Option or the Initial Value of an outstanding SAR, (b) cancel an outstanding Option or SAR in exchange for the grant of a new Option or SAR with a lower option price per share or Initial Value, (c) cancel an outstanding Option or outstanding SAR when the option price or Initial Value, as applicable, exceeds the Fair Market Value in exchange for cash or other Awards or (d) take any other action with respect to an outstanding Option or an outstanding SAR that may be treated as a repricing of the award under the rules and regulations of the New York Stock Exchange. No amendment shall, without a Participant’s consent, adversely affect any rights of such Participant under any outstanding award of Performance Shares, or under any Stock Award, Option or SAR outstanding at the time such amendment is made.
ARTICLE XVII
DURATION OF PLAN
No Stock Award, Performance Unit award, Option, SAR, Incentive Award or Other Equity-Based Award may be granted under this Plan after the tenth (10th) anniversary of the Effective Date; provided that no Incentive Stock Options may be granted more than ten (10) years after the earlier of approval by the Board or the shareholders of the Plan (or any amendment to the Plan that constitutes the adoption of a new plan for purposes of Section 422 of the Code). Stock Awards, Performance Unit awards, Options, SARs, Incentive Awards and Other Equity-Based Awards granted before such date shall remain valid in accordance with their terms.
ARTICLE XVIII
EFFECTIVE DATE OF PLAN
Options, Stock Awards, Performance Units, Incentive Awards and Other Equity-Based Awards may be granted under this Plan on reverse side 0000532417_2 R1.0.0.24and after the date that the Plan is adopted by the Board, provided that no award shall be exercisable, vested or settled unless, within twelve months after the Board’s adoption of the Plan, the Plan is approved by holders of a majority of the outstanding Common Stock entitled to vote and present or represented by properly executed and delivered proxies at a duly held shareholders’ meeting at which a quorum is present or by unanimous consent of the shareholders.
23